Plot Long Section
| Icon: |
|
| Menu: | Pipes > Plot Long Section |
| Ribbon: | Pipes Tab > Plan Production Panel > Plot Long Section |
Introduction
This command will create Long Section plots of an entire defined Pipe Network.
Long sections can be output as layouts in the current drawing or as separate drawings per sheet. Sheets are automatically created for the pipe network - users are able to establish their own title blocks as well as the areas defining a sheet. The list of title blocks is at the users control - refer to the CSD General Help System for more information.
Any defined pipe network (Drainage, Sewer, Utility, etc) can be plotted.
Before running this command users should first establish the Sequence Network - this is critical to the software grouping the pipes for presentation in long sections.
Pipe and structure labels can be included in the long section plot - users can set and apply pipe/structure labels using the Apply Object Names, Renumber/Rename Structures and Renumber/Rename Pipes commands.
Note: This command will only work on a defined Pipe Network.
Long Section Plot Components
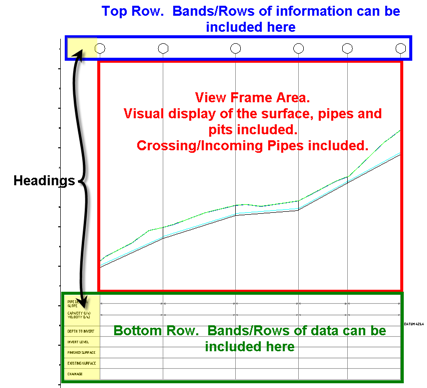
There are three (3) components of a Long Section plot, as shown below:
 |
|
| Top Rows | Bands/Rows of textual information can be presented above the View Frame; |
| View Frame | This is where the pipes and surfaces are presented (as well as the Hydraulic Grade Line, Sewer House Connections and other graphical features). This is the visual display area of the data in the long section plot; |
| Bottom Rows | Bands/Rows of textual information can be presented below the View Frame. |
Details
Upon selecting this command, the designer must select a network to plot. This can be achieved by either selecting the network in the drawing or from a list. Click here for more details on selecting a network.
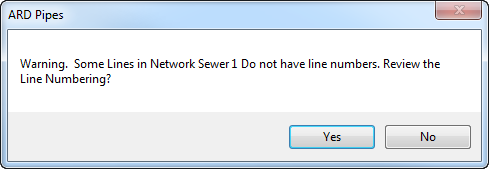
After a network is selected, the software will check to confirm that the Network has been completely sequenced. Should it find any pipes not defined in a sequenced branch the following form will display:
 |
|
| Yes | When YES is selected, the user will be taken directly to the Sequence Network command to fully sequence the network. After re-sequencing the network the user will need to restart the long section plot command. |
| No | This will not start the Sequence Network command. If no sequencing of the network has been applied, the command will stop. If the network is partially sequenced, those pipes and structures that are sequenced will be included in the long section plot output. |
Pipe Long Section Plotting
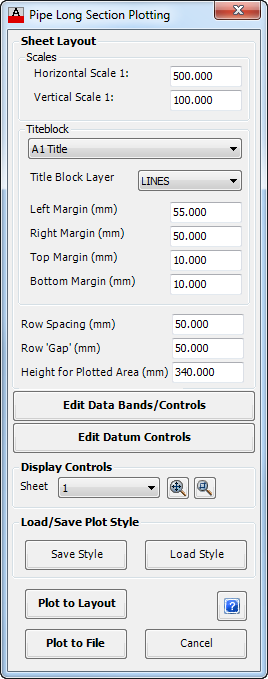
Once the network has been selected and branch sequencing is confirmed, the first sheet of the Pipe Long Section from the selected Pipe Network is shown as a plot preview in the PlotPreview Layout space and the following form is displayed:
Note: If the preview window shows a single vertical line, it is highly likely that either a top of structure level or pipe levels have been put at elevation zero (this commonly occurs if the structure/pipe is located outside of the nominated Design or Existing surface). Use Edit Structure and Edit Pipe to review and correct, then try plotting again).
|
|
| Sheet Layout | Overall Sheet Layout Controls for the scale, title block and spacings. |
| Scales | Controls the scales of the Long Section. |
| Horizontal Scale 1: | Set the horizontal scale for the plot. |
| Vertical Scale 1: | Set the vertical scale for the plot. |
| Titleblock | Control properties of the Title Block and plotting margins - Refer diagram below. |
| Title Block | Select a title block from the drop list. This defines the physical plot area and can include an official title block from any organisation. Note: The list of title blocks is at the users control - refer to the CSD General Help System for more information. |
| Title Block Layer | Select a layer which the Title Block will be placed on from the drop down list. |
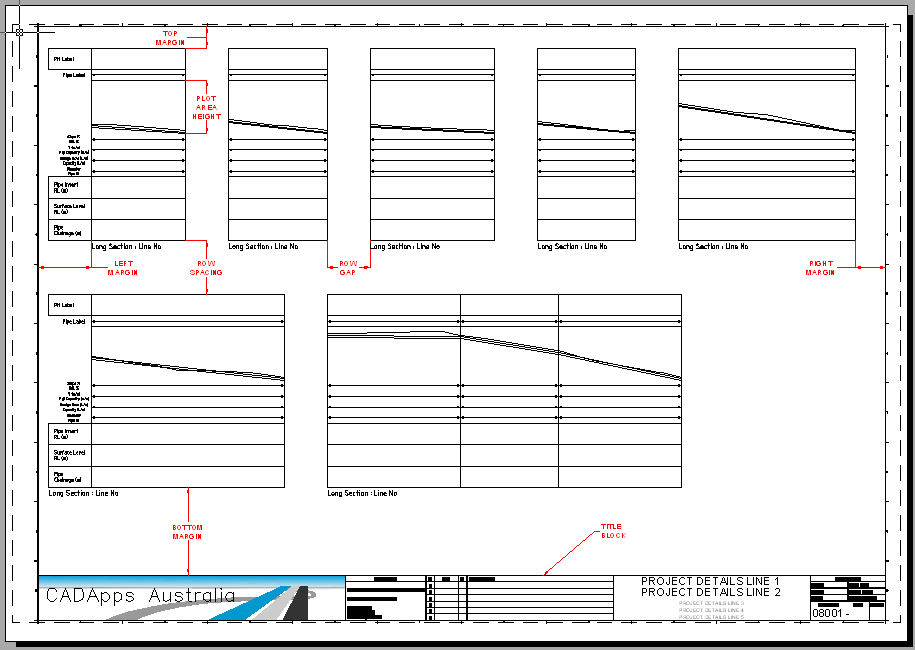
| Left Margin (mm) | Set the offset from the left edge of the plotting area to the start of the plotting. This sets the START horizontal position of the plot. |
| Right Margin (mm) | Set the minimum offset from the right edge of the plotting area to the end of the plotting. If this distance is exceed the program will start additional sheet/s as required. |
| Top Margin (mm) | Set the minimum offset from the top edge of the plotting area to the start of the plotting. This sets the START vertical position of the plot. |
| Bottom Margin (mm) | Set the offset from the bottom edge of the plotting area. Note: The Top Margin is the controlling factor for the position of the bottom of the long section plot heading rows. |
| Row Spacing (mm) | This is the vertical distance between long sections up the page - Refer diagram below. |
| Row 'Gap' (mm) | This is the horizontal distance between long sections across the page - Refer diagram below. |
| Height for Plotted Area (mm) | This is the overall plotted height of a long section - Refer diagram below. |
 |
Click this button to control what Data Bands and Controls is plotted on the Pipe Long Section. Click here for more information. |
 |
Click this button to control the Datum value for pipe segments based on user definable criteria. Click here for more information. |
| Display Controls | Zoom and Navigation Options |
| Sheet | Drop down list of sheets that will be created - pick a sheet to view from the list. |
| Zoom Extents | Click on this button to zoom the entire sheet view. |
| Zoom to Window | Click on this button to enable panning in the drawing and selection of a window to zoom to. |
Load/Save Plot Style |
Saving and Loading Plot Styles |
Save Style |
Save a copy of the current Plot Style settings to a file so that it can be used on future projects. A form will display to enable naming of the plot style. Important Note: Do NOT use any commas in the name. |
Load Style |
Load a saved Plot Style from file, previously saved using Save Style. A form will display to allow selection of the required saved plot style. |
Plot to Layout |
This button will output the plot sheets into separate Layout tabs within the current drawing. Each sheet will be named using the network name and sheet number. Note: When Plot to Layout is selected and a (unwanted) viewport appears in the new layout tab, is most likely caused by an AutoCAD option. At the command prompt, enter "op", select the "Display" tab, look for the option "Create viewport in new layouts", (bottom left of form) and uncheck the box, should solve this issue. |
Plot to File |
This button will output the plot sheets as separate drawing files. Files will be generated in the same directory as the drawing file in the folder /[drawing file name]-Data/AdvRoads/dwg/Profiles. |
Cancel |
Click on Cancel to exit the form without plotting. |
 |
After a change has been made to the Layout, Data Bands/Controls or Datum Controls this button will display over the "Plot to Layout", "Plot to File" and "Cancel". This forces the user to see the result of the changes made before being allowed to plot or continue. Click to update the PlotPreview display after making a change to the display controls. |
 OR
OR 
Sheet Layout Controls - Sketch
|
Edit Data Bands/Controls
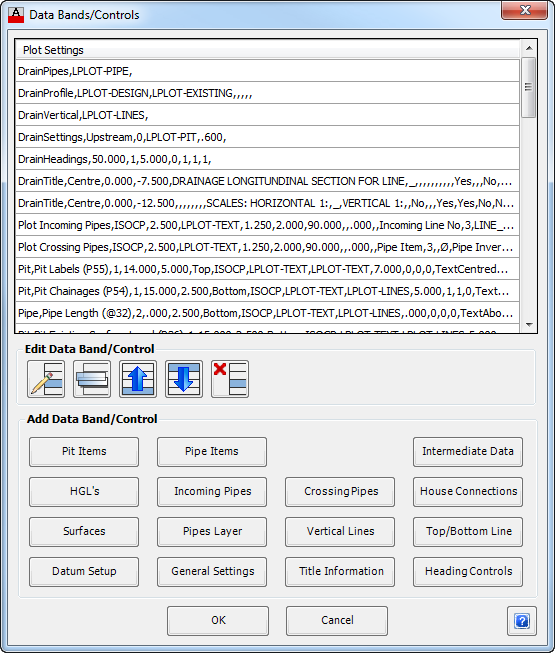
This form enable the setup of the long section plot display as well as allowing for the creation of Bands (Rows) of textual information above and below the view frame.
Important information about the use and application of the bands/controls is discussed below:
Form details are as follows:
Note: To review any particular control of interest, just click on the command button of interest.
|
|
| List of Data Bands/Controls | This lists all settings controls and bands/rows of data included in the Long Section Plot. Click on an item to highlight it for editing for deletion. The position of
Structure Items and Pipe Items will affect where they are presented in the rows/bands in the long section. The position of items in the list can be moved up/down.
Note: Users are encouraged add each entry and then review the effects before adding more, to limit confusion when creating/editing data in the list. |
| Edit Data Band/Control | Allows users to edit the information displayed in the Plot. |
 Edit Current Line Edit Current Line |
Edit the currently highlighted row. The inputs for editing are the same as for the item when it was created. |
 Copy Copy |
Copy the highlighted row and add it to the bottom of the list. This is a very useful method for making multiple rows of data based on another set row. Users are encouraged to create a row, set it up to present the way they like, and then make copies, changing the Band Item (the reportable data property) and the Heading text to suit. |
 Move Up Move Up |
Move the highlighted row up one to change the band order in the plot (for Structure Items and Pipe Items). The bands/rows are plotted in reverse order to their presentation in the List of Data Bands/Controls. |
 Move Down Move Down |
Move the highlighted row up one to change the band order in the plot (for Structure Items and Pipe Items). The bands/rows are plotted in reverse order to their presentation in the List of Data Bands/Controls. |
 Delete Current Line Delete Current Line |
Delete the highlighted row. |
| Add Data Band/Control | Includes a collection of tools to create display information in the View Frame as well as row/band data above or below the View Frame.
Each item added is presented in List of Data Bands/Controls to be repositioned in the list, edited, copied or deleted. |
| Structure Items | Click to add a Row/Band of textual information above/below the View Frame with text displayed at the structures. Click here for more information on this command control. |
| Pipe Items | Click to add a Row/Band of textual information above/below the View Frame with text displayed along the pipes. Click here for more information on this command control. |
| Intermediate Data | Click to add Rows/Bands of data below the View Frame with text displayed at a specified increment. Click here for more information on this command control. Note: This will only add information for Chainage, Existing Surface Levels, Design Surface Levels, Depth to Invert and/or Invert Levels. |
| HGL's | Click to add Hydraulic Grade Line/s in the View Frame. Click here for more information on this command control. Note: This is only applicable to Drainage Networks. |
| Incoming Pipes | Click to control the display of incoming pipes in the View Frame. Click here for more information on this command control. |
| Crossing Pipes | Click to control the display of crossing pipes in the View Frame. Click here for more information on this command control. |
| House Connections | Click to control the display of house connections in the View Frame. Click here for more information on this command control. |
| Surfaces | Click to add surfaces to display in the View Frame. Click here for more information on this command control. |
| Pipes Layer | Click to set the layer that the pipes will display on. Click here for more information on this command control. |
| Vertical Lines | Click to add vertical lines at the structures in the View Frame. Click here for more information on this command control. |
| Top/Bottom Line | Click to add a top/bottom line on the View Frame. Click here for more information on this command control. |
| Datum Setup | Click to add a Datum to the plot. Click here for more information on this command control. |
| General Settings | Click to establish the general settings controlling the plot. Click here for more information on this command control. |
| Title Information | Click to add the Title Information to the plot. Click here for more information on this command control. |
| Heading Controls | Click to set the Global Heading Controls. Click here for more information on this command control. |
OK |
Accept the current data and return to the Pipe Long Section Plotting form. |
Cancel |
Exit the form without changing the current data and return to the Pipe Long Section Plotting form. |
Notes for Using the Bands/Controls - Understanding Settings and Row Items
The band controls can be split into two functional groups:
| Plot Settings | These commands provide overall settings controls, generally over what is displayed in the view frame. These controls are generally independent of their position in the form, however users are encouraged to place them up the top to allow for a logical grouping. Settings type commands include:
|
| Row/Band Items | These are presented in REVERSE ORDER to the order they are presented in the data listing. Each Row/Band can be presented above (on top of) or below (on the bottom of) the View Frame. Each row represents some property/attribute of the network that is to be displayed on the long section (normally as text). Users can add:
|
Edit Datum Controls
This form provides complete user control over the assignment of datums to each pipe in the plot. Form details area as follows:
 |
|
| Datum Settings | Select the main criteria to be used for determining the Datum. |
| Compute Datum Based on Plot Settings | Using this option, all datums will be determined by the software based on the plot settings as set in the Edit Data Bands/Controls form. This is the Default case. |
| Use Set Datum | Select this option and enter the Datum to be used on ALL long sections for each pipe, irrespective of scale. |
| Use Datum Table for All Pipes | Select this option and the Datum will be set for ALL pipes, based on the vertical scale/s set in the Datum Table. |
| Use Pipe Datum Value and Datum Table | Select this option and the Datum used will be based on the Pipe Datum Value for each pipe segment (as defined in the Pipe Datum Value list), or if not set will be based on the Datum Table. |
| Use Pipe Datum Value and Plot Settings | Select this option and the Datum used will be based on the Pipe Datum Value for each pipe segment (as defined in the Pipe Datum Value list), or if not set will be based on the Plot Settings. |
| Datum Table | Set up a table to apply a fixed Datum based on the Vertical Scale set by the user. |
| Scale 1: | Enter up to three (3) different Vertical scales to match required output. |
| Datum (m) | Enter the corresponding Datum levels against the Scale. |
| Pipe Datum Value | Provides a list of all pipe segments so that a different Datum can be set for each and every pipe for up to three (3) different Vertical Scales. Only the last three Datum columns can be edited in this table. |
| Datum Scale 1, Scale 2 and Scale 3 | Enter the datum to be used for each pipe segment to match the three Vertical Scale/s set in the Datum Table above. |
| OK | Select OK to return to Pipe Long Section Plotting. |
| Cancel | Exit the form without making any changes to the datum controls. |