Plot Cross Sections (Legacy)
Icon: ![]()
![]()
Menu: Roads > Plot Cross Sections
Ribbon: Roads Tab > Plan Production Panel > Cross Sections
Introduction
THIS IS NOW A LEGACY COMMAND - THE LATEST FUNCTIONALITY TO SECTION PLOTTING IS FROM THE CROSS SECTION PLOTS COMMAND.
Following any sort of road design, it is likely that there will be a need to create cross section plots of the design for documentation and tendering purposes. The CSD Roads software includes the capacity to very quickly create cross section plots and with full control over the layout, scales, linetypes, colours, title blocks and other customisable drafting outputs.
The Cross Section Plotting command provides extensive tools for the presentation of a road design cross sections. Once the parameters have been set up, they can be saved as a named "style", so that they can easily be used for the other roads in the current drawing, or any other drawing.
Suggested Procedure
Initial Set Up - defining drafting output required
- Make a list of the layers, line types and colours required for your Cross Section plots.
- Use the
 Edit Plotting Layers command to establish the layers to be used.
 - If you have a Plot Style already defined, click on
 and the display will update. If not, follow the following steps:
- Start a Cross Sections plot. Select the General tab for overall layout and plotting scales. Adjust to your anticipated needs.
- Change to the Row Options tab and select the Set Row Information and complete the data there.
- Select the Formatting tab and check the data there changing anything obvious to your requirements.
- Select each of the remaining Tabs and establish required settings.
- Start a cross section plot, select the Set Plotting Layers Button from the Row Options tab and if it is required to adjust any layers established in the Edit Plotting Layers form.
- Save the settings with the
 button as required. An indication of the plot type and plotting scales in the file name may prove desirable e.g. Urban_100.
Final Setup - Suggested Procedure
- Plot the drawings and review the plotted output compared with your specific requirements.
- In most cases only a minor review of the options will be needed.
- If there are aspects of the plot which do not meet your needs review the documentation below for guidelines as to extra features available. Try different settings as required.
- Save the settings to temporary files as you test.
- When you have established a "settings set" to meet your needs save them to a permanent file, or to a series of files with variations (eg: Urban_250_50 for 1:250 horizontal scale and 1:50 vertical scale, Urban_500_100 for 1:500 horizontal scale and 1:100 vertical scale).
Finish Plotting using a saved Plot Style
- Start the Plot Cross Section command.
- Select Load Style and select the required settings file.
- Select Plot to Layout or Plot to File to output the cross sections.
Details
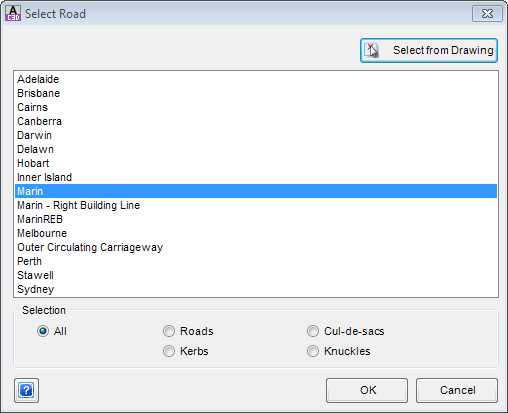
On starting the cross section plot command the Designer is requested to "Select Alignment or Press Enter to Select from a List:". So either select a Road Object in the drawing or if you press [Enter] the list box is displayed as shown below.
 |
|
| List of Road Alignment Objects | A list of Road Objects will appear in the main window of the form. Initially ALL Road Objects will be displayed in this list. Should the user want to shorten the list, select the appropriate button in the Selection options below.
The user must highlight one Road Object before picking [OK] or pick the Select from Drawing Button. |
| Selection | The user has the ability to change the list of Road Objects by selecting the appropriate radio button. |
| All | Selecting ALL will show all Road Objects. |
| Roads | Only alignments with a 'r-' in the description field will be listed. |
| Cul-de-Sacs | Only alignments with a 'cds-' in the description field will be listed. |
| Knuckles | Only alignments with a 'n-' in the description field will be listed. |
| Kerbs | Only alignments with a 'k-' in the description field will be listed. |
| OK | Apply and continue Plotting. The user must highlight one Road Object in the abovelist before picking OK or pick the Select from Drawing Button. |
| Select from Drawing | Return back to Model space to select the Road Object. |
| Cancel | Exit this command without Plotting. |
| Help | Open the Help file and display this information. |
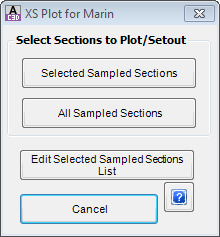
After a Road has been selected and [OK] has been pressed a form is then displayed to allow the selection of sections to be shown in the cross section plot.
 |
|
| Use this form to select the required sections for the cross section plotting. | |
| Selected Sampled Sections | Use only the Selected Sections list previously set up for plotting. |
| All Sampled Sections | Use All the extracted sections for plotting. |
| Edit Selected Sampled Sections List | Select this to edit the list of chainages to use for plotting. |
| Cancel | Exit this command without plotting. |
| Help | Open the Help file and display this information. |
After selecting either Selected Sampled Sections or All Sampled Sections, a preliminary set of cross sections is plotted into a layout tab called PlotPreview and the Cross Section form as discussed below is opened.
Cross Section Plotting - General
The cross section plotting provides a great deal of flexibility in displaying cross section data. The cross section plotting process can create a series of Layout tabs within the current drawing. Alternatively the process can create a series of separate drawing files which can be plotted or used as a external reference file (XREF).
See the section Suggested Procedure above for generating and controlling your cross section plot display.
Using the Plot Controls
After starting the command the first sheet of the Cross Sections for the selected Road is shown as a plot preview in the PlotPreview Layout tab. A multi-tabbed form is displayed providing the Designer with the capability of changing all aspects of the plot appearance. The form to control the total output is as follows:
 |
Click on one of the Tabs at the top of the form (General, Row Options, Formatting, Select, Chainage, Datum, Crossfalls, Extra Offsets), shown left, to find out more about each tab.
The functional buttons available from all Tabs are described below: |
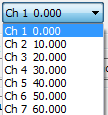
| Display Controls | This allows to user to select different pages to display if there is more than one and provides standard zoom functions. |
 |
Pick list for selecting which page to view. |
 |
Pick list for selecting which cross section to zoom to. |
 Zoom Extents Zoom Extents |
Click on this button to zoom the entire sheet view. |
 Zoom to Window Zoom to Window |
Click on this button and then to zoom or pan in the PlotPreview use the mouse wheel. |
| Load/Save Plot Style | This allows the user to save the current plotting setup as style that can be later loaded for use on other jobs. |
|
Save a copy (style set) of the current output settings. Note: All plot style settings are saved in the 'common' folder where configuration files are stored - click here for more information regarding storage of configuration files. |
 |
Load a saved plot style set from the Save Style command. |
| Plotting Options | The user can either plot to Layout tabs or separate files. If any variable has been changed, the buttons in this area will be covered with an Update Display button, which must be selected before continuing. |
 |
This button will output the plot sheets into separate Layout tabs within the current drawing. |
 |
This button will output the plot sheets as separate drawing files. Files will be generated in the same directory as the drawing file in the folder /'[drawing file name]-Data'/AdvRoads-10/Xsects |
 Cancel Cancel |
Exit this command without Plotting. |
 Help Help |
Open the Help file and display this information. |
 |
This will update the preview display after making a change to the display controls. The control does not show unless a change has been made and not Updated. |
Principles of Common Settings
For most of the text fields, the following properties may be set:
| Trailing zeroes | Select from a list of Yes and No to plot trailing zeroes. |
| Trailing decimals | Select from a list of Yes and No to plot trailing decimals. |
| Number of decimals | Select 0, 1, 2, 3 or 4 for the number of decimals places required. |
| Character Height | Enter character height (mm or inches). |
| Character Width | Enter character width. |
| Font | Select the font. Note: The program may use True Type fonts for display. While these fonts plot correctly, they may not display correctly. |
| Colour | Select the colour. |
Individual Tabs
Return to Top Return to Plot Controls Return to Suggested Procedure
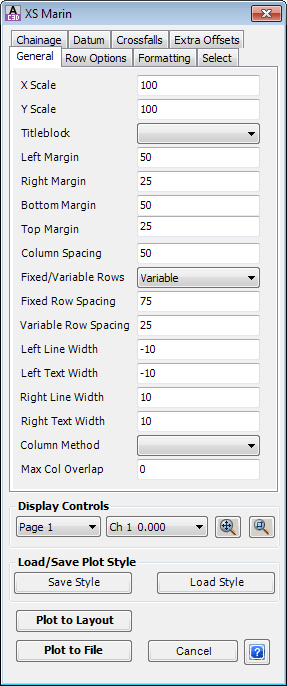
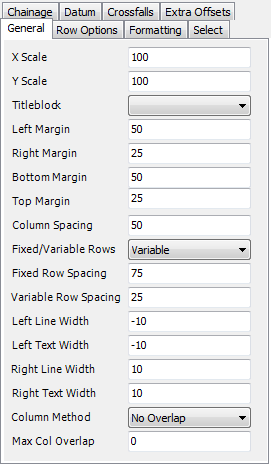
General tab
This tab enables the Designer to set the overall layout characteristics for display of cross sections in the section plot.
 |
|
| X Scale | This sets the Horizontal scale for the plot. |
| Y Scale | This sets the Vertical scale for the plot. |
| Titleblock | Select a title block from the drop down list.
The list of available files derives from the |
| Left Margin | Set the offset from the left edge of the plotting area to the start of the plotting. The value is in plotted millimetres/inches. |
| Right Margin | Set the minimum offset from the right edge of the plotting area to the end of the plotting. If this distance is exceeded the program will start additional tabs/drawings as required. The value is in plotted millimetres/inches. |
| Bottom Margin | Set the offset from the bottom edge of the plotting area to the start of the plotting. The value is in plotted millimetres/inches. |
| Top Margin | Set the minimum offset from the top edge of the plotting area to the start of the plotting. The value is in plotted millimetres/inches. |
| Column Spacing | Spacing between columns of cross section data. The value is in plotted millimetres/inches. |
| Fixed/Variable Rows | There are two options for setting the height between each cross section:
|
| Fixed Row Spacing | If Fixed Distance has been set, this is the height between each cross sections row. The value is in plotted millimetres/inches. |
| Variable Row Spacing | If Variable has been set, this is the height between each cross sections row. The value is in plotted millimetres/inches. |
| Left Line Width | Offset distance to show cross section line work to the left. See note below. |
| Left Text Width | Offset distance to show the offset/level text information about the cross section. See note below. |
| Right Line Width | Offset distance to show cross section line work to the right. See note below. |
| Right Text Width | Offset distance to show the offset/level text information about the cross section. See note below. |
| Column Method | There are three options to control the distance between each Select from
This feature is designed to allow the column widths to vary, if the batter points go outside the left/right text widths specified above. |
| Max Col Overlap | Enter the distance for the maximum column overlap. The value is in plotted millimetres/inches. |
Note: Expect unusual results if the Line Width and Text Width values are not matched. These Widths can be overridden via the Row Data/Band Form controls.
Return to Top Return to Plot Controls
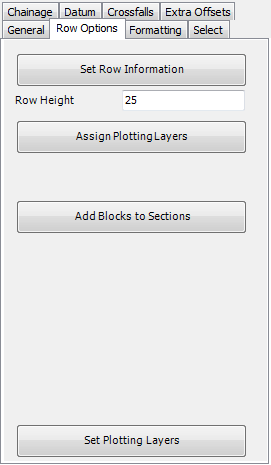
Row Options tab
This tab enables the Designer to adjust the Row Information, assign and set plotting layers and add AutoCAD blocks of the plotted layout.
 |
||
 |
This command opens the Cross Section Data Bands/Control form as documented below. The form controls the items to be labelled in the text rows, the row labels and the precision. | |
| Row Height | This value sets the height of all data labelling rows. The value is in plotted millimetres/inches. | |
 |
This command opens the Plotting Preferences form as documented below. The form controls the details of the text style and layers for text and linework. The layers used here MUST be first set up in the Layer List. | |
 |
This command opens the Select Symbols form as documented below. This allows symbols to be attached to selected labels over selected chainage ranges. | |
 |
This aspect of the command is described by the |
|
Return to Top Return to Plot Controls Return to Suggested Procedure
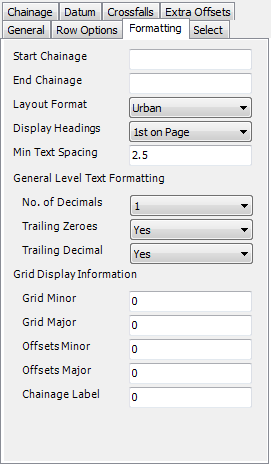
Formatting tab
This tab enables the Designer to adjust the general formatting of the plotted layout.
 |
|
| Start Chainage | Set the start chainage for sections to be plotted. The default is -1E+30, i.e. effectively before the start of the road. |
| End Chainage | Set the end chainage for sections to be plotted. The default is -1E+30, i.e. effectively before the start of the road in which case the end of the road is used. |
| Layout Format | A list of several formats for the plot including:
|
| Display Headings | A list of options for plotting the row labels:
|
| Min Text Spacing | Set the minimum spacing between vertical leader lines such that the lines are cranked to avoid text overlap. The value set has little effect on the finished layout. |
| General Level Text Formatting | Provides some default controls for text fields, if not set elsewhere. |
| No. of Decimals | Select 0, 1, 2, 3 or 4 for number of decimals places required. |
| Trailing Zeros | Select from a list of Yes and No to plot trailing zeroes. |
| Trailing Decimal | Select from a list of Yes and No to plot trailing decimals. |
| Grid Display Information | Provides controls to display grids on cross sections. |
| Grid Minor | Sets the spacing for the minor vertical grid lines. |
| Grid Major | Sets the spacing for the major vertical grid lines. |
| Offsets Minor | Sets the spacing for the minor horizontal grid lines. |
| Offsets Major | Sets the spacing for the major horizontal grid lines. |
| Chainage Label | Reserved. The default Station Format is x+00. |
Return to Top Return to Plot Controls
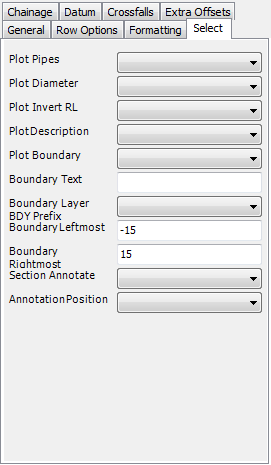
Select tab
This tab enables the Designer to select the features from the CSD Pipes design to be plotted on the sections, as well as other controls.
Notes: To show the Drainage, Sewer or Service pipes on the Road cross sections, Designers must have completed a drainage design using CSD Pipes.To show the dimensions on the cross sections (Annotate) Designers must first create the dimension standards using the
 |
|
| To show CSD Pipes on the Road Cross Sections, select any or all of the followings items: | |
| Plot Pipes | A list of Yes and No can be used to set whether the Pipes plot. |
| Plot Diameter | A list of Yes and No can be used to set whether the Diameters plot. |
| Plot Invert RL | A list of Yes and No can be used to set whether the Invert RLs plot. |
| Plot Description | A list of Yes and No can be used to set whether the Descriptions plot. |
| Property Boundary entries have been superseded by the Boundary Line and Boundary by Layer buttons in the Row/Data Band form. | |
| Plot Boundary | <unused> |
| Boundary Text | <unused> |
| Boundary Layer BDY prefix | <unused> |
| Boundary Left Most | <unused> |
| Boundary Right Most | <unused> |
| To show dimension labels on the Road Cross Sections, change the following items: | |
| Section Annotate | Select from a list of previously defined Annotations. |
| Annotation Position | Select from a list of:
|
Return to Top Return to Plot Controls
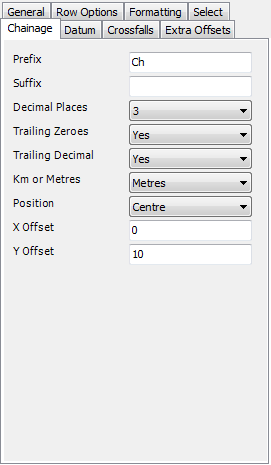
Chainage tab
This tab enables the Designer to set characteristics of the text for the Chainage label each Cross Section.
 |
|
| Prefix | A Prefix for the chainage label of each section. Include spaces in the text where required. |
| Suffix | A Suffix for the chainage label of each section. Include spaces in the text where required. |
| Decimal Places | Select 0, 1, 2, 3 or 4 for number of decimals places required. If you select 0, then a decimal point is still plotted. If the decimal point is not needed set Trailing Decimal to No. |
| Trailing Zeroes | Select from a list of Yes and No to plot trailing zeroes. |
| Trailing Decimal | Select from a list of Yes and No to plot trailing decimals. |
| Km or Metres | A list gives options of kilometres or metres. |
| Position | A list gives options of where the chainage label is to be place. Options area Left, Centre and Right. Select the required position of the label. |
| X Offset | An offset in plotted millimetres/inches for the text from the location selected under the Position option. Note: -ve for Left and +ve for Right. |
| Y Offset | An offset in plotted millimetres/inches for the text from the location selected under the Position option. Note: -ve for Up and +ve for Down. |
Return to Top Return to Plot Controls
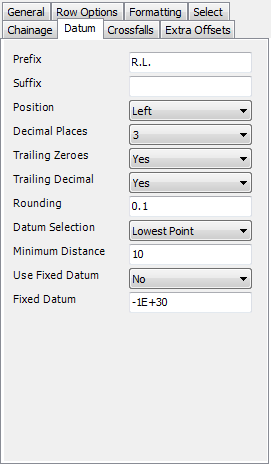
Datum tab
This tab enables the Designer to select the characteristics of the Datum label to be plotted on the sections and to control its value with rounding.
 |
|
| Prefix | Type in a prefix if required, typically R.L. or DATUM. Add spaces where required. |
| Suffix | Type in a suffix if required, typically m. Add spaces where required. |
| Position | Select from a list of Left or Right. The datum text is then placed on the Left or Right side of the Cross Section. |
| Decimal Places | Select from a list of 0, 1, 2, 3 or 4 decimal places to display. If you select 0, then a decimal point is still plotted. If the decimal point is not needed set Trailing Decimal to No. |
| Trailing Zeroes | Select from a list of Yes and No to plot trailing zeroes. |
| Trailing Decimal | Select from a list of Yes and No to plot trailing decimals. |
| Rounding | Set the level of rounding for the Datum level. Select 1 to round to the nearest metre, or 0.5 to round to the nearest 0.5m etc. |
| Datum Selection | To set where the Datum Level is based on, select from a list of:
|
| Minimum Distance | Enter the minimum distance in plotted millimetres/inches from the Datum Line to the Datum Selection. |
| Use Fixed Datum | A list of Yes and No can be used to set whether the fixed datum is used on all sections. |
| Fixed Datum | Enter the required fixed datum in metres. |
Return to Top Return to Plot Controls
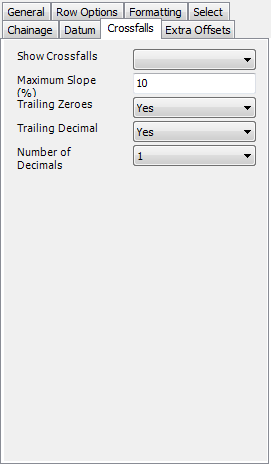
Crossfalls tab
This tab enables the Designer to set characteristics for display of cross falls in the section plot.
 |
|
| Show Crossfalls | A drop down list with options for:
|
| Maximum Slope (%) | This sets the maximum slope which will be labelled as a percentage grade. Slopes greater than this value are labelled as slopes with the format 1 in XX where XX is the horizontal distance in metres for a rise of one metre. |
| Decimal Places | Select 0, 1, 2, 3 or 4 for number of decimals places required. |
| Trailing Zeroes | Select from a list of Yes and No to plot trailing zeroes. |
| Trailing Decimal | Select from a list of Yes and No to plot trailing decimals. |
Return to Top Return to Plot Controls
Extra Offsets tab
This tab enables the Designer to plot additional labels at selected cross section labels or for set offsets at each cross section.
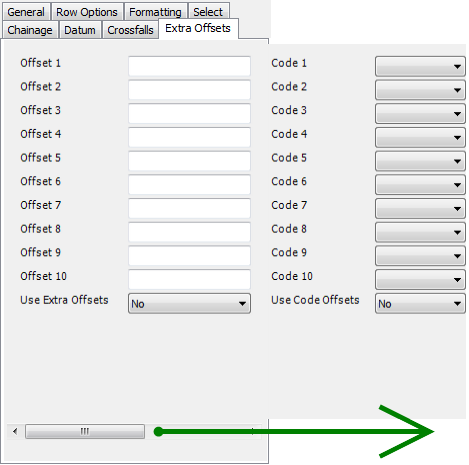 Note: These settings are only enabled if the Layout Format is set to No Offsets - click here to see where to change the format. |
|
| Offsets | Set values next to Offset 1 through Offset 10 as desired to show offset/level information at set offsets from the C.L.
Use Extra Offsets: change to Yes to use the Extra Offsets set. |
| Use Extra Offsets | A Yes or No list determines the extra offset entered above are used. |
| Codes | Set values next to Code1 through Code 10 as desired to pick labels of the cross section to show offsets/levels for. This is normally set by the Designer at the time of creating the cross section label.
Use Code Offsets: change to Yes to use the Codes set. Note: You will need to scroll to the right of the form and to see these! |
| Use Code Offsets | A Yes or No list determines the extra codes entered above are used. |
Return to Options Tab Return to Suggested Procedure
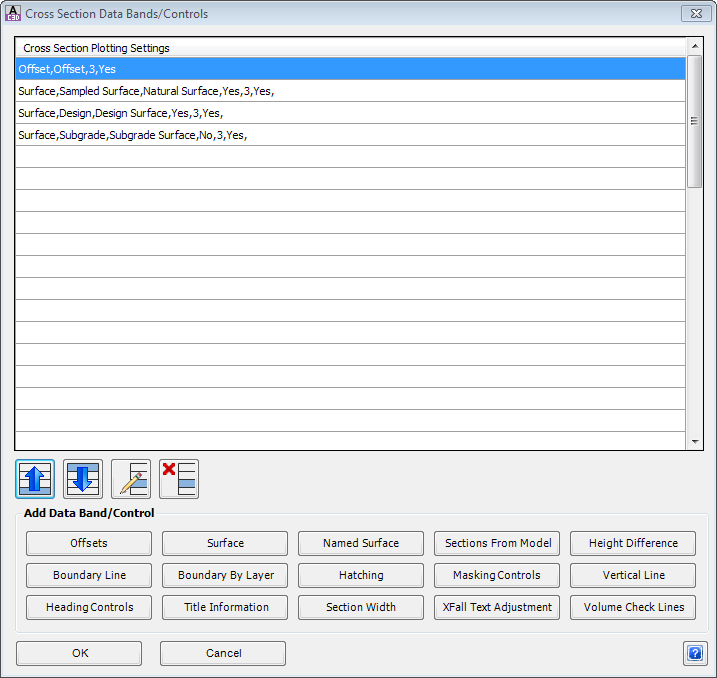
Set Row Information
This form which is opened from the Options Tab enables the Designer to define the rows of data to be included in the labelling.
The items can easily be edited or moved as required, depending on the type of plot being produced. The information in this table is saved with the plotting data ("Save Style"), so it can be easily used for other drawings.
 |
|
| Cross Section Plotting Settings | This contains a list of Row Data or Controls that will be plotted on each cross section. The order of the list is significant, with the item at the top of the list plotted as the first bottom row, and the last item of the list plotted at the top rows. Buttons are provided below to shuffle items up and down the list as may be required. To ADD items, click on one of the options in the Add Data Band/Control panel below. Users can also EDIT or DELETE items. |
 |
When this button is clicked, the highlight row in the above list will be moved Up one row. |
 |
When this button is clicked, the highlight row in the above list will be moved Down one row. |
 |
When this button is clicked, the highlight row in the above list, the form associated with this item will be opened for Editing. |
 |
When this button is clicked, the highlight row in the above list will be Deleted. |
| Add Data Band/Control | Each button controls a set of row data that can added to each cross section when plotted. The new item will always be added to the bottom of the list. To change its position, use the Up and Down arrows as described above. A more detailed explanation of each Data Band or Control is provided below. |
 |
Accept the current data and return to the plot cross section form. |
| Cancel |
Exit this form without changing data. |
| Help |
Open the Help file and display this information. |
Add Data Band/Control
There are a number of options for displaying row data in the Long Section. Detailed descriptions are given below. In all forms below the Windows Red X, OK, Cancel and Help buttons have the standard meanings and functions.
 Offsets Offsets |
|
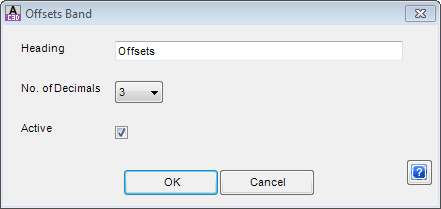
This row data is for Offsets. This item can NOT be deleted. |
|
| Heading | Enter the Heading for the particular Data Band being entered. Only a 1 line heading can be plotted. |
| No of Decimals | Select 0, 1, 2, 3 or 4 for the number of decimals places required. |
| Active | A tick box is provided. Placing a tick means the item is active and will be plotted. Leaving the box empty, means that this will not be plotted. |
 Surface Surface |
|
This row data is for Surfaces created as part of the Road Design. |
|
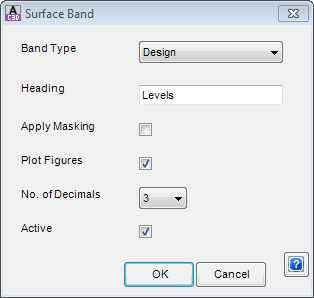
| Band Type | Selects the surface to be plotted. Choices are: Sampled Surface, Design, Subgrade, Offset Existing, Cut Strings. |
| Heading | Enter the Heading for the particular Data Band being entered. Only a 1 line heading can be plotted. |
| Apply Masking | A tick box is provided. Placing a tick means that masking will be applied. Leaving the box empty, means that masking will not be used. |
| Plot Figures | A tick box is provided. Placing a tick means that Figures (levels as text) will be plotted. Leaving the box empty, means that this will not be plotted. |
| No of Decimals | Select 0, 1, 2, 3 or 4 for the number of decimals places required. |
| Active | A tick box is provided. Placing a tick means the item is active and will be plotted. Leaving the box empty, means that this will not be plotted. |
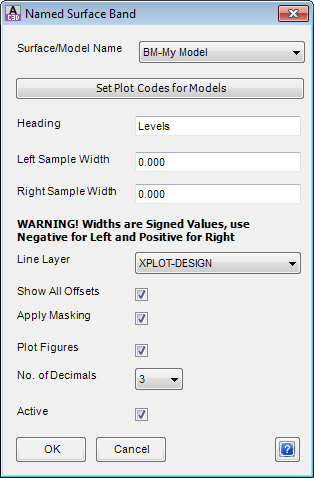
This row data is for any Named Surface or any CSD Model. Any surface can be shown using this option. One or more Models can be shown, with the added benefit of controlling the Codes to plot for each Model. |
|
| Surface/Model Name | From the drop down list provided select the required Surface or Model to plot.
If a Model is selected, the user can set the Codes from the Model that are to be plotted in the bands. For a surface, ALL grade breaks are included in the bands. |
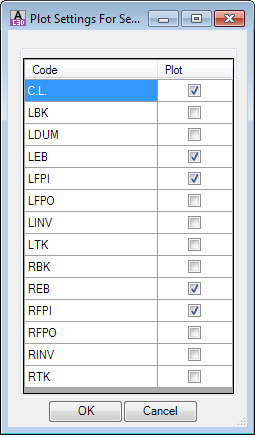
| Set Plot Codes for Models | Click here to edit the Codes that are to be displayed and reported in the bands. All codes from the Model are displayed - tick on the ones that are to be included. Form is shown, below:
Click OK to save the codes, or Cancel to exit without saving settings |
| Heading | Enter the Heading for the particular Data Band being entered. Only a 1 line heading can be plotted. |
| Left Sample Widths | In the box provided enter the offset to control the amount of information plotted or searched. Note: -ve for Left and +ve for Right of the Alignment. |
| Right Sample Widths | In the box provided enter the offset to control the amount of information plotted or searched. Note: -ve for Left and +ve for Right of the Alignment. |
| Line Layer | Select the layer for the line to be drawn on, from the drop list provided. |
| Show All Offsets | A tick box is provided. Recommended to tick ON for a Model and OFF for a surface (unless it is desired to show all grade breaks of the surface in the bands/rows). |
| Apply Masking | A tick box is provided. Placing a tick means that masking will be applied. Leaving the box empty, means that masking will not be used. |
| Plot Figures | A tick box is provided. Placing a tick means that Figures (levels as text) will be plotted. Leaving the box empty, means that this will not be plotted. |
| No of Decimals | Select 0, 1, 2, 3 or 4 for the number of decimals places required. |
| Active | A tick box is provided. Placing a tick means the item is active and will be plotted. Leaving the box empty, means that this will not be plotted. |
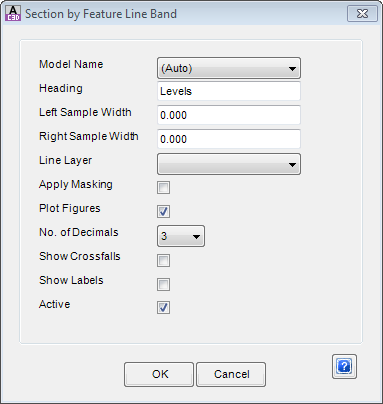
This row data is for Feature Lines that has been used to create a Surface Model. Using this option produces 'true' cross sections as the surface is plotted based on feature or string lines rather than offsets from a template. |
|
| Model Name | From the drop down list provided select the required Model Name to plot string lines from. |
| Heading | Enter the Heading for the particular Data Band being entered. Only a 1 line heading can be plotted. |
| Left Sample Widths | In the box provided enter the offset to control the amount of information plotted or searched. Note: -ve for Left and +ve for Right of the Alignment. |
| Right Sample Widths | In the box provided enter the offset to control the amount of information plotted or searched. Note: -ve for Left and +ve for Right of the Alignment. |
| Line Layer | Select the layer for the line to be drawn on, from the drop list provided. |
| Apply Masking | A tick box is provided. Placing a tick means that masking will be applied. Leaving the box empty, means that masking will not be used. |
| Plot Figures | A tick box is provided. Placing a tick means that Figures (levels as text) will be plotted. Leaving the box empty, means that this will not be plotted. |
| No of Decimals | Select 0, 1, 2, 3 or 4 for the number of decimals places required. |
| Show Crossfalls | A tick box is provided. Placing a tick means Crossfalls will be plotted between feature lines. Leaving the box empty, means that this will not be plotted. |
| Show Labels | A tick box is provided. Placing a tick means Labels (or Codes) matching the feature lines will be plotted. Leaving the box empty, means that this will not be plotted. |
| Active | A tick box is provided. Placing a tick means the item is active and will be plotted. Leaving the box empty, means that this will not be plotted. |
 Height Difference Height Difference |
|
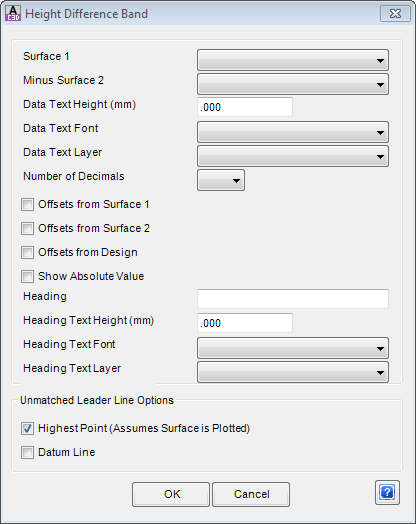
This row data is used to show the Height Difference (Cut/Fill) between two selected surfaces. |
|
| Surface 1 | From the drop down list provided select the required Surface to use. |
| Minus Surface 2 | From the drop down list provided select the required Surface to use. |
| Data Text Height (mm) | Enter the Height (in mm) for the text size. |
| Data Text Font | From the drop list provided, select the Text Font style to be used. |
| Data Text Layer | Select the layer for this text to be drawn on, from the drop list provided. |
| No of Decimals | Select 0, 1, 2, 3 or 4 for the number of decimals places required. |
| Offsets from Surface 1 | A tick box is provided. Placing a tick means Offsets for Surface 1 will be plotted. Leaving the box empty, means that this will not be plotted. |
| Offsets from Surface 2 | A tick box is provided. Placing a tick means Offsets for Surface 2 will be plotted. Leaving the box empty, means that this will not be plotted. |
| Offsets from Design | A tick box is provided. Placing a tick means Offsets from Design will be plotted. Leaving the box empty, means that this will not be plotted. |
| Show Absolute Value | A tick box is provided. Placing a tick means values plotted will not a have '+' or '-' prefix. Leaving the box empty, means that this will not be plotted. |
| Heading | Enter the Heading for the particular Data Band being entered. Only a 1 line heading can be plotted. |
| Heading Text Font | From the drop list provided, select the Text Font style to be used. |
| Heading Text Layer | Select the layer for this text to be drawn on, from the drop list provided. |
| Unmatched Leader Line Options | This is used to control where the leader line terminates, when unmatched. |
| Highest Surface | A tick box is provided. Placing a tick means the Leader will extend up to the Highest (Surface) Point. Leaving the box empty, means that this will not be occur. |
| Datum Line | A tick box is provided. Placing a tick means the Leader will stop at to the Datum Line. Leaving the box empty, means that this will not be occur. |
 Boundary Line Boundary Line |
|
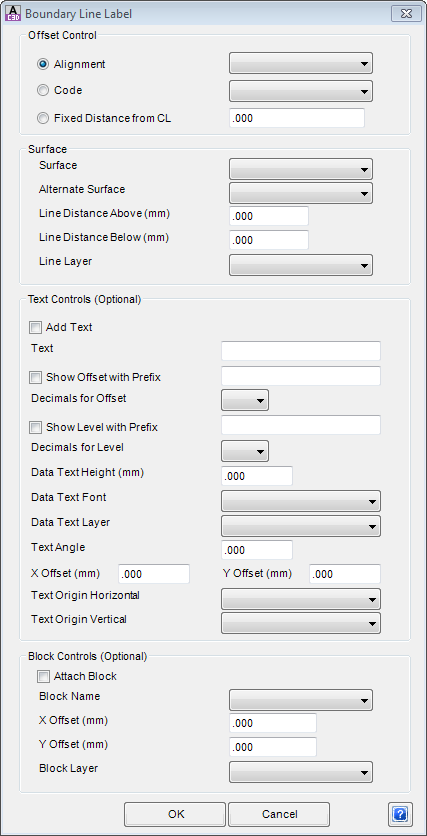
This control is for the display of Boundary Line Labels which is based on an Alignment, Code or Fixed Distance. This control can be used for any other feature to be drawn on the cross sections, for example line marking, fences, guard rails or building line. |
|
| Offset Control | This provides control on which offset is used to define the boundary line. Note: This will label the Boundary on one side only. Two entries will be needed to label the left and right boundary lines, which may have different offset controls. |
| Alignment | If the boundary follows a particular alignment (already created), select this option then select the Alignment from the drop down list provided. |
| Code | If the boundary is required along a particular code, select this option then select the code from the drop down list provided. |
| Fixed Distance from CL | If the boundary is at fixed offset from the control alignment, select this option and enter the offset in the box provided. |
| Surface | This provides level control for where the information is to be added. |
| Surface | From the drop down list provided select the required Surface to use. |
| Alternate Surface | From the drop down list provided select an Alternate Surface to use, should the first surface not exist at the nominated Offset. |
| Line Distance Above (mm) | Enter the length of the line to be drawn (in mm), upward starting from the nominated surface. |
| Line Distance Below (mm) | Enter the length of the line to be drawn (in mm), downward starting from the nominated surface. |
| Line Layer | Select the layer for this line to be drawn on, from the drop down list provided. |
| Text Controls (Optional) | An optional control is provided to place text, indicating the boundary or similar. |
| Add Text | A tick box is provided. Placing a tick means the Text will be added at the nominated offset. Leaving the box empty, means that this will not be occur. |
| Text | Enter the required text to display on the cross section plot. |
| Show Offset with Prefix | A tick box is provided. Placing a tick means the Prefix will be added to the Offset value. Then enter the Prefix in the box provided. Leaving the box empty, means that this will not be occur. |
| Decimals for Offset | Select 0, 1, 2, 3 or 4 for the number of decimals places required. |
| Show Level with Prefix | A tick box is provided. Placing a tick means the Prefixwill be added to the Level value. Then enter the Prefix in the box provided. Leaving the box empty, means that this will not be occur. |
| Decimals for Level | Select 0, 1, 2, 3 or 4 for the number of decimals places required. |
| Data Text Height (mm) | Enter the Height (in mm) for the text size. |
| Data Text Font | From the drop list provided, select the Text Font style to be used. |
| Data Text Layer | Select the layer for this text to be drawn on, from the drop list provided. |
| Text Angle | Enter an angle (decimal degrees) to draw the text at. |
| X Offset (mm) | Enter a X offset (in mm) to shift the starting point for the textual information. Note: -ve for Left and +ve for Right. |
| Y Offset (mm) | Enter a Y offset (in mm) to shift the starting point for the textual information. Note: -ve for Down and +ve for Up |
| Text Origin Horizontal | From the drop list provided, select either Left, Middle or Right to control the horizontal start position of the text. |
| Text Origin Vertical | From the drop list provided, select either Bottom, Middle or Top to control the vertical start position of the text. |
| Block Controls (Optional) | An optional control to add a Block at the nominated offset. This block must exist in the common folder. |
| Attach Block | A tick box is provided. Placing a tick means the selected Block will be added at the nominated offset. Leaving the box empty, means that this will not be occur. |
| Block Name | Select the block to be placed, from the drop list provided. |
| X Offset (mm) | Enter a X offset (in mm) to shift the starting point. Note: -ve for Left and +ve for Right. |
| Y Offset (mm) | Enter a Y offset (in mm) to shift the starting point. Note: -ve for Down and +ve for Up |
| Block Layer | Select the layer to place this block on, from the drop list provided. |
 Boundary by Layer Boundary by Layer |
|
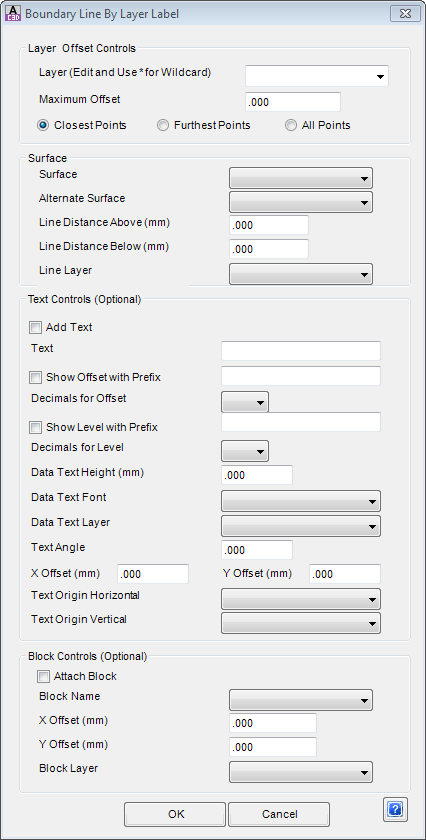
This control is for the display of Boundary Line Labels which is based on a Layer or Layers. |
|
| Layer Offset Controls | This provides control on which layer is used to define the boundary line. |
| Layer (Edit and Use * for Wildcard) | Select a layer, from the drop down list provided or enter the layer name in the box provided. If a layer is selected, it can be edited and wildcards are permitted to select multiple layers. |
| Maximum Offset | Enter the maximum offset (each side of the alignment) to search for lines from the nominated layer(s). |
| Points | Select 1 of the 3 toggles provided:
|
| Surface | This provides level control for where the information is to be added. |
| Surface | From the drop down list provided select the required Surface to use. |
| Alternate Surface | From the drop down list provided select an Alternate Surface to use, should the first surface not exist at the nominated Offset. |
| Line Distance Above (mm) | Enter the length of the line to be drawn (in mm), upward starting from the nominated surface. |
| Line Distance Below (mm) | Enter the length of the line to be drawn (in mm), downward starting from the nominated surface. |
| Line Layer | Select the layer for this line to be drawn on, from the drop down list provided. |
| Text Controls (Optional) | An optional control is provided to place text, indicating the boundary or similar. |
| Add Text | A tick box is provided. Placing a tick means the Text will be added at the nominated offset. Leaving the box empty, means that this will not be occur. |
| Text | Enter the required text to display on the cross section plot. |
| Show Offset with Prefix | A tick box is provided. Placing a tick means the Prefix will be added to the Offset value. Then enter the Prefix in the box provided. Leaving the box empty, means that this will not be occur. |
| Decimals for Offset | Select 0, 1, 2, 3 or 4 for the number of decimals places required. |
| Show Level with Prefix | A tick box is provided. Placing a tick means the Prefixwill be added to the Level value. Then enter the Prefix in the box provided. Leaving the box empty, means that this will not be occur. |
| Decimals for Level | Select 0, 1, 2, 3 or 4 for the number of decimals places required. |
| Data Text Height (mm) | Enter the Height (in mm) for the text size. |
| Data Text Font | From the drop list provided, select the Text Font style to be used. |
| Data Text Layer | Select the layer for this text to be drawn on, from the drop list provided. |
| Text Angle | Enter an angle (decimal degrees) to draw the text at. |
| X Offset (mm) | Enter a X offset (in mm) to shift the starting point for the textual information. Note: -ve for Left and +ve for Right. |
| Y Offset (mm) | Enter a Y offset (in mm) to shift the starting point for the textual information. Note: -ve for Down and +ve for Up |
| Text Origin Horizontal | From the drop list provided, select either Left, Middle or Right to control the horizontal start position of the text. |
| Text Origin Vertical | From the drop list provided, select either Bottom, Middle or Top to control the vertical start position of the text. |
| Block Controls (Optional) | An optional control to add a Block at the nominated offset. This block must exist in the common folder. |
| Attach Block | A tick box is provided. Placing a tick means the selected Block will be added at the nominated offset. Leaving the box empty, means that this will not be occur. |
| Block Name | Select the block to be placed, from the drop list provided. |
| X Offset (mm) | Enter a X offset (in mm) to shift the starting point. Note: -ve for Left and +ve for Right. |
| Y Offset (mm) | Enter a Y offset (in mm) to shift the starting point. Note: -ve for Down and +ve for Up |
| Block Layer | Select the layer to place this block on, from the drop list provided. |
 Hatching Hatching |
|
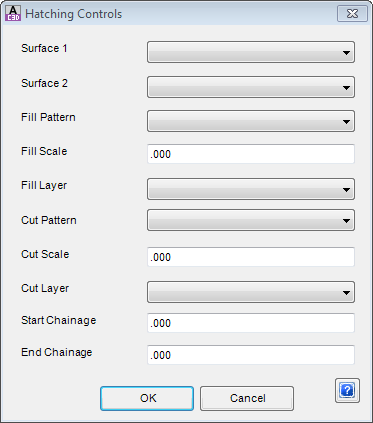
This allows Hatching to be created on the cross sections between two nominated surfaces. |
|
| Surface 1 | From the drop down list provided select the required Surface to use. |
| Surface 2 | From the drop down list provided select the required Surface to use. |
| Fill Pattern | Select a Pattern to use from the drop down list. |
| Fill Scale | Enter a suitable scale. If the scale is incorrect, there will be too much hatching and it will be very slow. |
| Fill Layer | Select the Layer for the fill pattern. |
| Cut Pattern | Select a Pattern to use from the drop down list. |
| Cut Scale | Enter a suitable scale. |
| Cut Layer | Select the Layer for the cut pattern. |
| Start and End Chainage | Specify the range for where the Hatching is to be applied. |
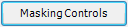 Masking Controls Masking Controls |
|
This control is to mask or hide design and datum lines based on the criteria selected. |
|
| Mask Type | The mask type defines whether Align 1 or Align 2 are used and what part is masked. The types are:
|
| Align 1 | Select an Alignment from the drop down list provided. Note: The required alignments need to exist. |
| Align 1 Trim | Select Yes or No to use and trim to Align 1. |
| Align 2 | Select an Alignment from the drop down list provided. Note: The required alignments need to exist. |
| Align 2 Trim | Select Yes or No to use and trim to Align 2. |
 Vertical Line Vertical Line |
|
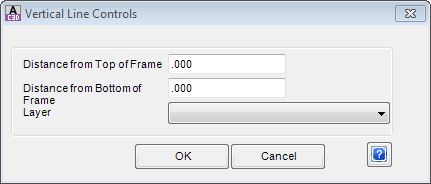
This control draws a vertical line at the alignment control line. |
|
| Distance from Top of Frame | Enter the distance to stop the line from the top of the Frame, in millimetres/inches. |
| Distance from Bottom of Frame | Enter the distance to start the line from the bottom of the Frame, in millimetres/inches. |
| Layer | Select the layer for the line to be drawn on, from the drop list provided. |
 Heading Controls Heading Controls |
|
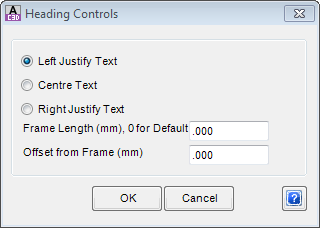
This control is for the Cross Section heading box displayed on the left hand side of the cross section. |
|
| Text justification | Select the radio button to control how the Heading Text is to be justified within the Heading Box. Select either Left, Centre or Right. |
| Frame Length (mm) | Enter the Length of the Frame in the box provided. Leaving blank or zero, the default length will be used. |
| Offset from Frame (mm) | Enter the Heading Text offset from the frame. |
 Title Information Title Information |
|
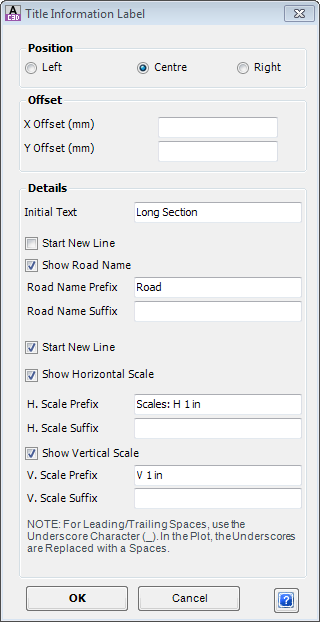
This command opens the above form where the Designer can add Title Information. |
|
| Position | Select required the toggle for the Title position: Left, Centre or Right. The location is set relative to the bottom row of the Cross Sections. |
| Offsets | Nominate an offset (in mm) for the Title Information Label text to be moved in the X and Y direction as may be required. Note: For the X Offset, -ve for Left and +ve for Right. Any value in the Y Offset will move the Title down. |
| Details | Check on the items to be shown in the Titles text. For most items, a prefix and a suffix can be included. Use the underscore (_) to achieve a space. It is replaced by a space when plotted. There are options to start new lines, to help separate the information. |
| Initial Text | Add in some initial text that may describe the cross sections. |
| Start New Line | Tick this box, to start the Road Name and any following information on a new line to display it below the Initial Text. |
| Show Road Name | Tick the box to add in the Alignment name as part of the title information. There are options to add a Prefix and or a Suffix to this item. |
| Start New Line | Tick this box, to start the Scale information on a new line to display it below the Initial Text or Road Name. |
| Show Horizontal Scale | Tick the box to add in the Horizontal Scale as part of the title information. There are options to add a Prefix and or a Suffix to this item. |
| Show Vertical Scale | Tick the box to add in the Vertical Scale as part of the title information. There are options to add a Prefix and or a Suffix to this item. Note this item will placed on the same line as the Horizontal Scale. |
 Section Width Section Width |
|
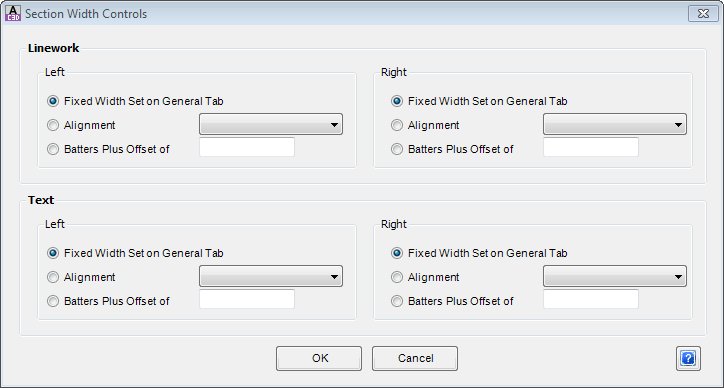
This control allows the width of the plotted cross section to vary depending of the variable selected, for both linework and text, independent of what is set on the General Tab. |
|
| Linework | Options are provided so that the Left and Right sides can be controlled independently. |
| Fixed Width Set on General Tab | Select this Toggle and the width will be set to match that on the General Tab. |
| Alignment | Select this Toggle and then an Alignment from the drop down list provided to control the width of the section. Note: The required alignments need to exist. |
| Batters Plus Offset of | Select this Toggle and then enter a distance (in metres) in the box provided to add to the batter intersection point offset. |
| Text | Options are provided so that the Left and Right sides can be controlled independently. |
| Fixed Width Set on General Tab | Select this Toggle and the width will be set to match that on the General Tab. |
| Alignment | Select this Toggle and then an Alignment from the drop down list provided to control the width of the section. Note: The required alignments need to exist. |
| Batters Plus Offset of | Select this Toggle and then enter a distance (in metres) in the box provided to add to the batter intersection point offset. |
 XFall Text Adjustment XFall Text Adjustment |
|
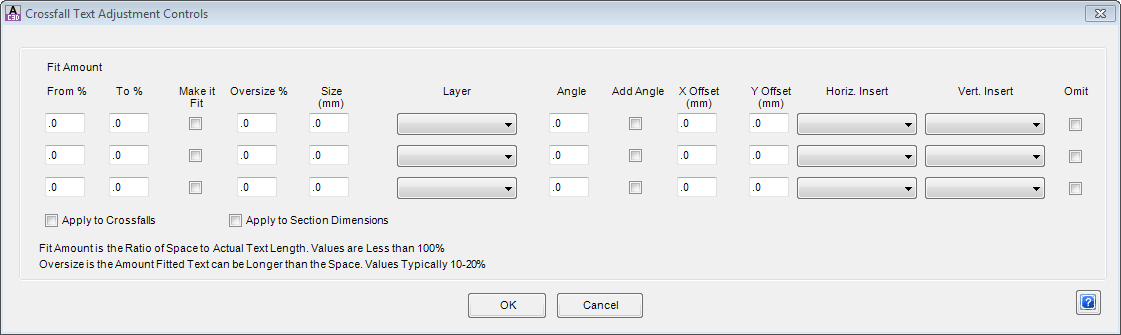
This control gives users the ability to manipulate the way the crossfalls are displayed. Up to three ranges of crossfalls can be user defined and the controls for each are described below: |
|
| From % | Indicate the starting (lower) value for this range. |
| To % | Indicate the ending (higher) value for this range. |
| Make It Fit | A tick box is provided. Placing a tick means the item is 'moved' to fit. Leaving the box empty, means that this will not be moved. |
| Oversize % | Enter a value that allows the Crossfall text length can exceed its corresponding line length. Typical values would be less than 20%. |
| Size (mm) | Enter the Height (in mm) for the text size. |
| Layer | Select the layer for the line to be drawn on, from the drop list provided. |
| Angle | Enter an angle (decimal degrees) to draw the text at. |
| Add Angle | A tick box is provided. Placing a tick means that the text angle will be the addition of the crossfall slope and the Angle specified in the previous field. Leaving the box empty, means the angle will not be added. |
| X Offset (mm) | Enter a X offset (in mm) to shift the starting point for the textual information. Note: -ve for Left and +ve for Right. |
| Y Offset (mm) | Enter a Y offset (in mm) to shift the starting point for the textual information. Note: -ve for Down and +ve for Up. |
| Horiz Insert | From the drop list provided, select either Left, Middle or Right to control the horizontal start position of the text. |
| Vert Insert | From the drop list provided, select either Bottom, Middle or Top to control the vertical start position of the text. |
| Omit | A tick box is provided. Placing a tick means the item is OMITTED from the plot. Leaving the box empty, means that this will be plotted. |
 Volume Check Lines Volume Check Lines |
|
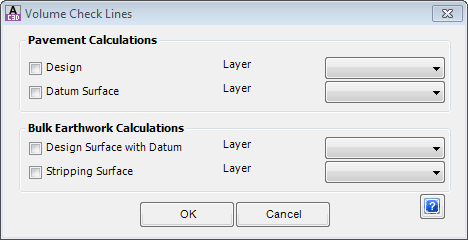
This control is used to display Check lines for volume calculations, either to the Design or Datum surface for Pavement and either Design with Datum and Stripping for Bulk Earthworks. These lines can then be used to check the areas at each section and perform a manual check on volume calculations. |
|
| Pavement Calculations | This will draw lines to the limits of the pavement extents to check pavement volumes. |
| Design | A tick box is provided. Placing a tick means the item is active and will be plotted. Leaving the box empty, means that this will not be plotted. |
| Layer | Select the layer for the line to be drawn on, from the drop list provided. |
| Datum Surface | A tick box is provided. Placing a tick means the item is active and will be plotted. Leaving the box empty, means that this will not be plotted. |
| Layer | Select the layer for the line to be drawn on, from the drop list provided. |
| Bulk Earthworks Calculations | This will draw lines to the earthworks limits and can include the stripped surface to check earthworks volumes. |
| Design Surface with Datum | A tick box is provided. Placing a tick means the item is active and will be plotted. Leaving the box empty, means that this will not be plotted. |
| Layer | Select the layer for the line to be drawn on, from the drop list provided. |
| Stripping Surface | A tick box is provided. Placing a tick means the item is active and will be plotted. Leaving the box empty, means that this will not be plotted. |
| Layer | Select the layer for the line to be drawn on, from the drop list provided. |
Return to Options Tab Return to Suggested Procedure
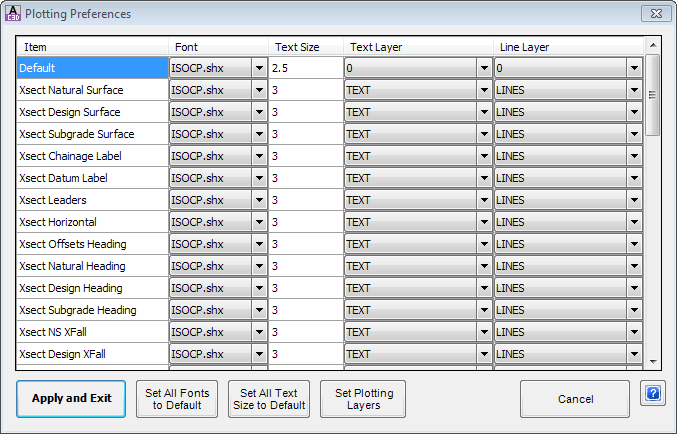
Plotting Preferences (from Assign Plotting Layers button)
This form which is opened from the Options Tab enables the Designer to set the layers and text styles to be used in the section plot.
The top line of data is the default data and Designers can set data in this line and then use the Set Fonts to Default and Set Text Size to Default to apply those settings to all items in the column.
Most of these items are unnecessary in practice and in general the defaults settings will not need to be changed.
 |
|
Item Table |
A list of items for which settings data can be edited. Each Item correlates with a part of the cross section. Some Item's only have either lines or text describing them - users can set the controls for the display of the lines and text associated with each Item. For each Item the Designer can assign the following drafting controls |
| Item | The available items are listed and are not user editable. The list includes the following items:
|
| Font | Select a Font Style from the drop down list of Text Styles derived from the Fonts.txt file. |
| Text Size | Key in the required plot height of the text in millimetres, assuming a 1:1 plot scale. |
| Text Layer | Select a layer from the drop down list of layers to place text for the respective Item. |
| Line Layer | Select a layer from the drop down list of layers to place lines for the respective Item. |
| Apply and Exit | To accept and apply changes and exit. |
| Set All Fonts to Default | Upon pressing this button, all Font Styles will be reset to match that set in the Default value in the first row. |
| Set All Text Size to Default | Upon pressing this button, all Text Size will be reset to match that set in the Default value in the first row. |
| Set Plotting Layers | This will open a new window containing a Layer List. This aspect of the command is described by the |
| Cancel |
Exit this form without changing data. |
| Help |
Open the Help file and display this information. |
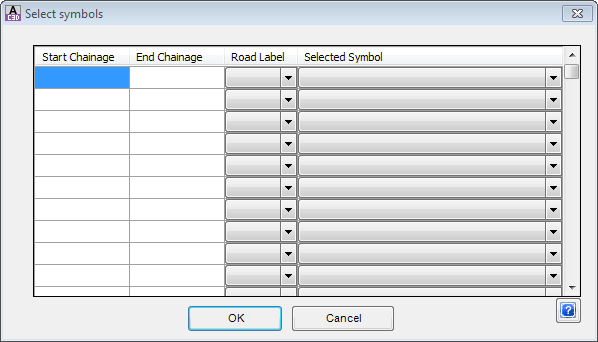
Add Blocks to Sections
This Form which is opened from the Options Tab enables the Designer to add Symbols or Blocks onto cross sections based on a Road Label. For example Light Poles, Guide Posts or Kerb Shapes.
Note: In the Edit Row/Band form, Boundary by Layer and Boundary by Line can be used to achieve a similar result to this option - in the cae of Boundary by Layer any polyline/s on selected layers can be used to locate blocks for display on the sections
 |
|
| Start Chainage | Set the start chainage for Symbols to be plotted from. |
| End Chainage | Set the end chainage for Symbols to be plotted. |
| Road Label | Select the required label from the pick list. |
| Selected Symbol | Select the required symbol. The list of symbols is obtained from the drawings in the CSD Settings folder (click on the |
|
Apply and exit. |
| Cancel |
Exit this form without changing data. |
| Help |
Open the Help file and display this information. |