Profile Views
Icon: |
|
| Menu: | Roads > Profile Views > Profile Views |
| Ribbon: | Roads Tab > Plan Production Panel > Profile Views Split View > Profile Views |
Introduction
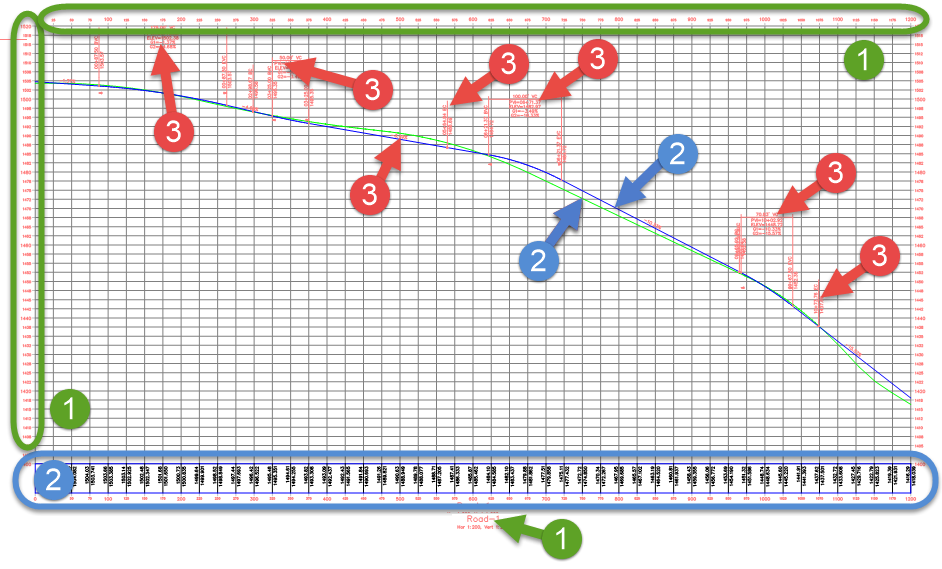
This command creates USA style profile views, with or without bands at the bottom of the view frame.
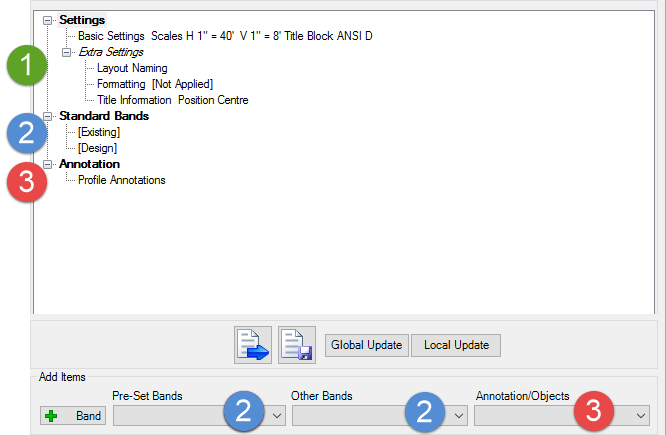
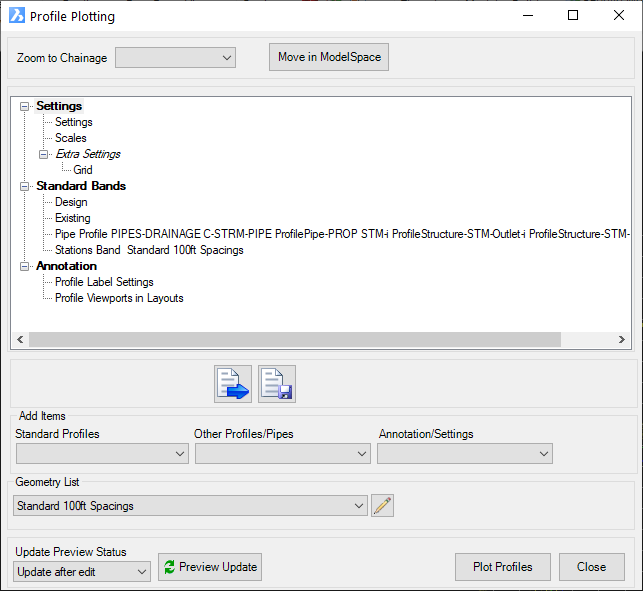
The inputs for display of the grid, profiles, bands and annotation is managed via a Treeview list of inputs, categorized by control: Settings, Bands and Annotations - this makes searching, adding and editing entries in profile view form easy. All items can be edited with a double click, whilst more mouse functionality has been incorporated with edit, delete & copy being available on the right click.
Entry items have been categorized for ease of use, making it easier to find and add items to the profile views.
1. All settings are found at the top of the form - control grid spacing for the view, exaggeration, title, datum and output sheet names.
2. All profiles and bands are available from the new pulldown at the bottom of the form. Adding a Band controls whether to display the profile, the band at the bottom and the heading.
3. Annotations are typically associated with the design profile and are added here. Annotations include labeling of the design profile, adding a Viewport to the output and adding user selected station/elevation labels to the view.
 |
 |
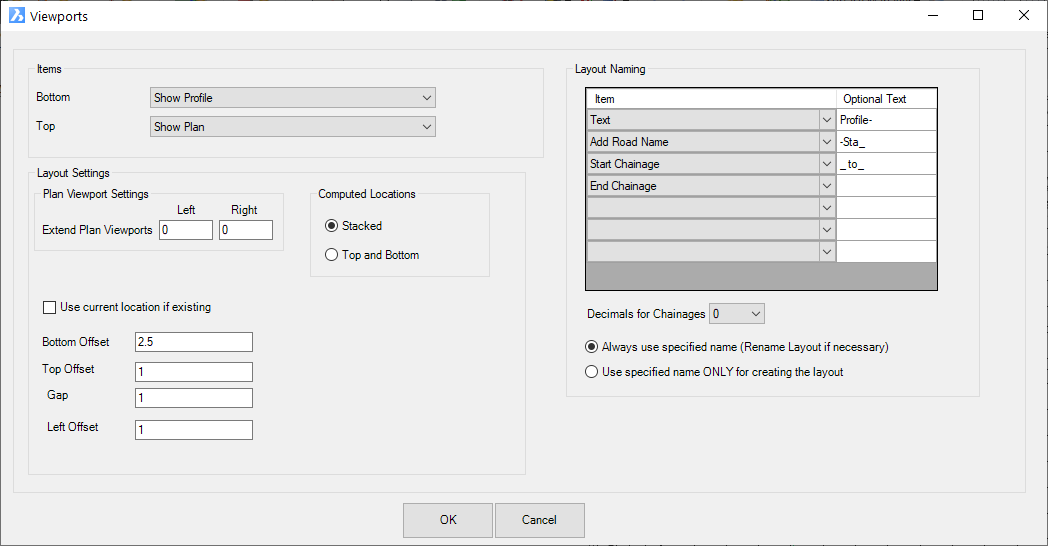
| Add in a Plan Viewport to show a viewport above or below the profile view. | 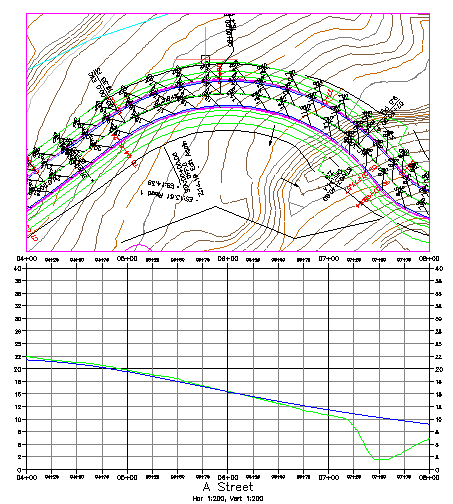 |
| Station/Elevation labels can be added to the view by the user. | 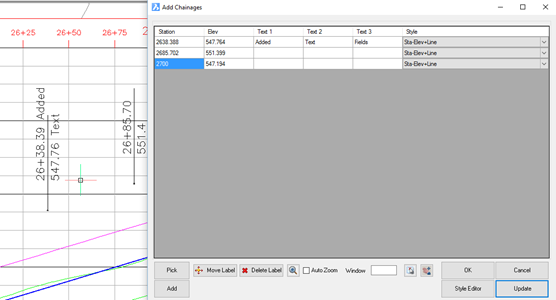 |
The Hyperlinks below can be used to jump to the relevant group of interest. FORM CONTROLS | SETTINGS | STANDARD BANDS | OTHER PROFILES/PIPES | ANNOTATION/SETTINGS |
|
Upon starting the command a new layout tab is created named Plotting Preview, and a preview of the output profile view sheets is displayed in that layout. The views in that layout are updated as the profile view plot output is edited. Each sheet can subsequently be output to individual layouts, or each sheet can be output to individual files.
General Process
- On starting the Profile View command the Designer is requested to "Select Alignment or Press Enter to Select from a List:". So either select a string (represented by an alignment or polyine) in the drawing or if you press [Enter] a list box is displayed for selection of a String to plot. Select a string and click OK, or Cancel to exit. A Selection panel enables filtering of the list to particular types of Strings.
- Following selection of a String the Profile View form will display. Details are below.
Dynamics During Editing
When the Profile View window is displayed, any edits made to the vertical grading of the string, or other edits that trigger a rebuild of the model, will result in an immediate update of the profile views presented in the Section Preview layout tab.
Annotations can be grip edited using standard CAD commands (grip edit selection, move, rotate) and will maintain repositioned locations (subject to how the label style was defined).
Navigation
Right click functionality has be added to provide access to a number of tools. Double clicking has also been added to provide quick access item edits.
Details
Profile Viewing - General
The Profile Viewer provides a great deal of flexibility in displaying cross section data. The Profile Viewer process can create a series of Layout tabs within the current drawing. Alternatively the process can create a series of separate drawing files which can be plotted or used as a external reference file (XREF).
Using the Plot Controls
 |
|||||||||||||||
| Plot Position Controls | |||||||||||||||
| Zoom to Chainage | Pick a Station to Zoom to in the drawing. | ||||||||||||||
| Move in Model Space | Click to move the Profile View position. A temporary line will display from the current insertion point (bottom left of the profile view) to the new position. Left click to select a new position for the Profile View in the drawing. |
||||||||||||||
Profile View Setup - click on a hyperlink below to jump to that section of controls SETTINGS | STANDARD BANDS | OTHER PROFILES/PIPES | ANNOTATION/SETTINGS |
|||||||||||||||
| Load/Save Plot Style | This allows the user to save the current plotting setup as style that can be later loaded for use on other jobs. | ||||||||||||||
| Save a copy (style set) of the current output settings. Note: All plot style settings are saved in the 'common' folder where configuration files are stored - click here for more information regarding storage of configuration files. | |||||||||||||||
| Load a saved plot style set from the Save Style command. | |||||||||||||||
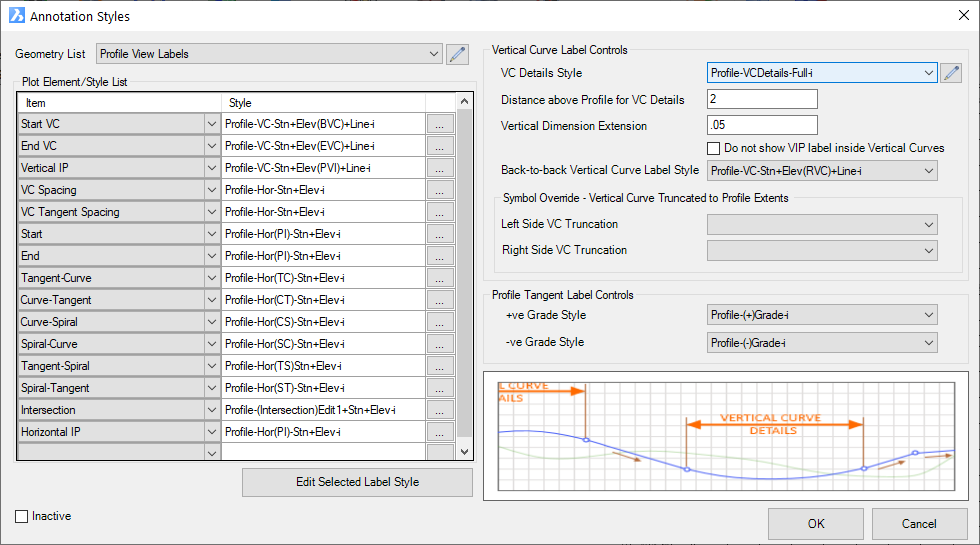
| Geometry List | Apply a named list to manage the labels on the Design Profile Labels added (you can override this via the Profile Label Settings). | ||||||||||||||
| Geometry
List |
Use the pick list to select a geometry
list - if a list is selected, the labels that are presented will
be controlled by the named list, unless set by individual bands
or other settings. The form is shown, below: 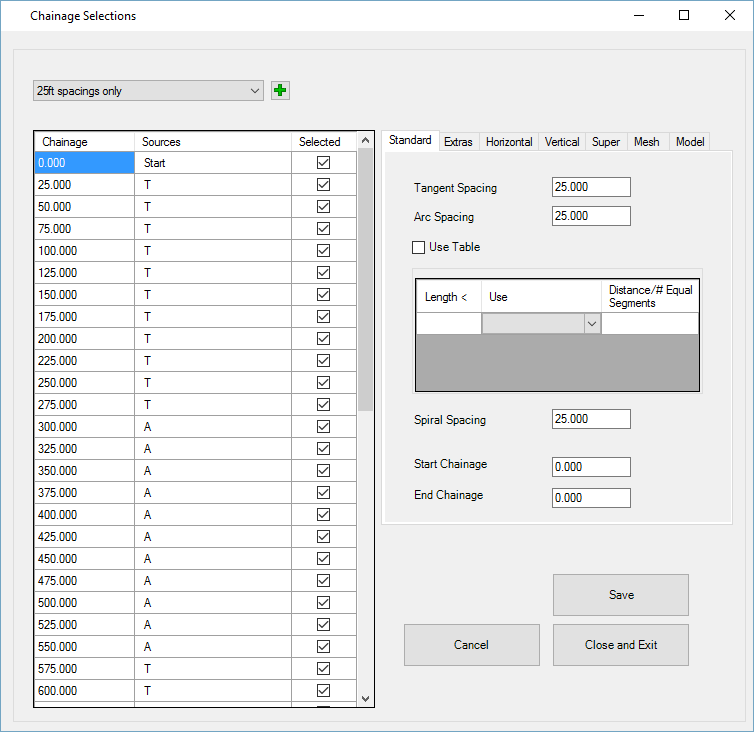 For information on creating and editing Geometry lists, see the Section Manager command. |
||||||||||||||
| Edit List | Select the icon to edit the selected Geometry list. | ||||||||||||||
| ProfileSheets | |||||||||||||||
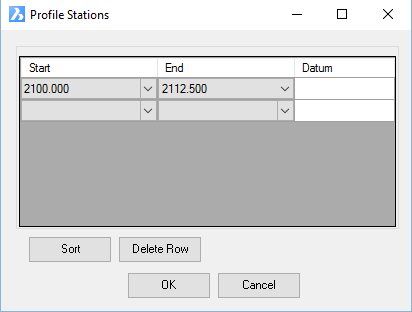 By default, profiles will extend for the full extents of each sheet (as defined by the Title Block). This command lets users set the sheets of profiles by station ranges (which can be overlapping) and specifying datums per sheet. Each line in the list will generate a new Sheet (output as a file or to a layout).
|
|||||||||||||||
| Update Preview Status | |||||||||||||||
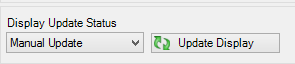 Any updates made to the Profile Viewer form will not update the preview state of the profile views. Selecting Update Display will update the preview. |
|||||||||||||||
| Plotting Options | |||||||||||||||
| Plot Profiles | Click here to update the profile views or, if not already created in the drawing, to select a position to place the profile views | ||||||||||||||
| Close | Exit without editing the output. | ||||||||||||||
SETTINGS, BAND AND ANNOTATION CONTROLS
Data has been grouped into settings, profile/band and annotation controls. All options are listed below in the relevant groups. Use the Hyperlinks below to jump to the relevant group of interest.
SETTINGS | STANDARD BANDS | OTHER PROFILES/PIPES | ANNOTATION/SETTINGS
Settings Controls
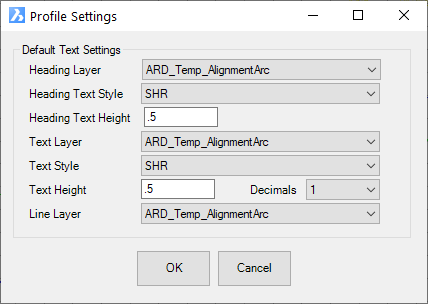
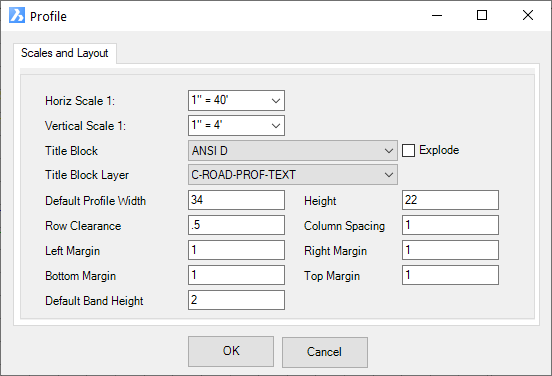
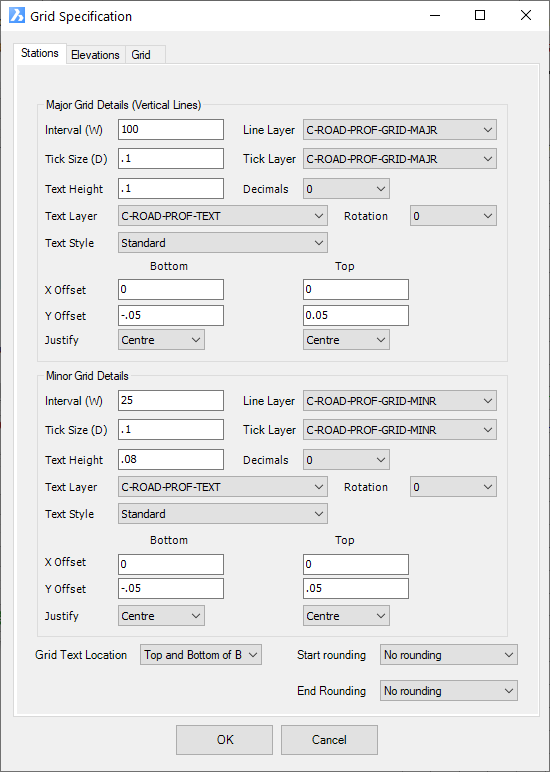
Settings - this form provides defaults for display and is overridden when a Band is added. Band text is controlled by Label Styles, rather than these text inputs. Heading Layer Set a default layer for displaying Headings for bands Heading Text Style Set a text style Heading Text Height Set a text height Text Layer Set a default layer for displaying Text for bands Text Style Set a text style Text Height Set a text height Decimals Decimals for test display Line Layer Set layer for vertical lines in the bands OK Apply and exit Cancel Exit without applying changes Scales - This form sets up the horizontal and vertical scales for the profile view as well as title block to use and sheet sizes for automatic pagination. Note: pagination controls can be set via the 'Chainage Ranges' band. Horiz Scale 1: Set the scale using the picklist Vertical Scale 1: Set the scale using the picklist Title Block Pick a title block to apply - this will only be applied if Profile Viewports are being created via the Viewports band. The Title Block size and plot extents is established by the Title Block Settings command. Explode Explode the title block on insert Title Block Layer Set the layer for the title block Default Profile Width Sets the sheet width Height Sets the sheet height Row Clearance Sets the spacing between rows of profile views Column Spacing Sets the spacing between columns of profile views Left Margin Offset the first profile view from the title block Right Margin Offset from the right edge of the title block Bottom Margin Offset from the bottom of the title block Top Margin Offset from teh top of the title block Default Band Height Set a default height for any Bands added to the top/bottom of the Profile View Extra Settings > Grid Settings - Establish the grid information to display for the Profile View Stations Tab - manages the horizontal axes labels and grid Major Grid Details Interval Set the major grid interval Line Layer layer for the grid lines Tick size length of tick lines that extend outwards from the edge of the view frame Tick Layer layer for tick lines Text Height height of text Decimals Number of decimals to display Text Layer layer to draw the text on at each grid Rotation Text rotation - use pick list Text style select a text style x offset x offset from insertion point. Inputs are separated for Bottom (below view) and Top (above view) y offset y offset from insertion point. Inputs are separated for Bottom (below view) and Top (above view) Justify Set the text justification. Inputs are separated for Bottom (below view) and Top (above view) Minor Grid Details Interval Set the minor grid interval Line Layer layer for the grid lines Tick size length of tick lines that extend outwards from the edge of the view frame Tick Layer layer for tick lines Text Height height of text Decimals Number of decimals to display Text Layer layer to draw the text on at each grid Rotation Text rotation - use pick list Text style select a text style x offset x offset from insertion point. Inputs are separated for Bottom (below view) and Top (above view) y offset y offset from insertion point. Inputs are separated for Bottom (below view) and Top (above view) Justify Set the text justification. Inputs are separated for Bottom (below view) and Top (above view) Grid Text Position Pick where to display the text (top, bottom, as well as whether to locate at view or outside of bands Start Rounding Applies a Rounding to setting the Start of each Profile View, where multiple views are required for the string. Rounding is to the Grid (major or minor) End Rounding Applies a Rounding to setting the End of each Profile View, where multiple views are required for the string.
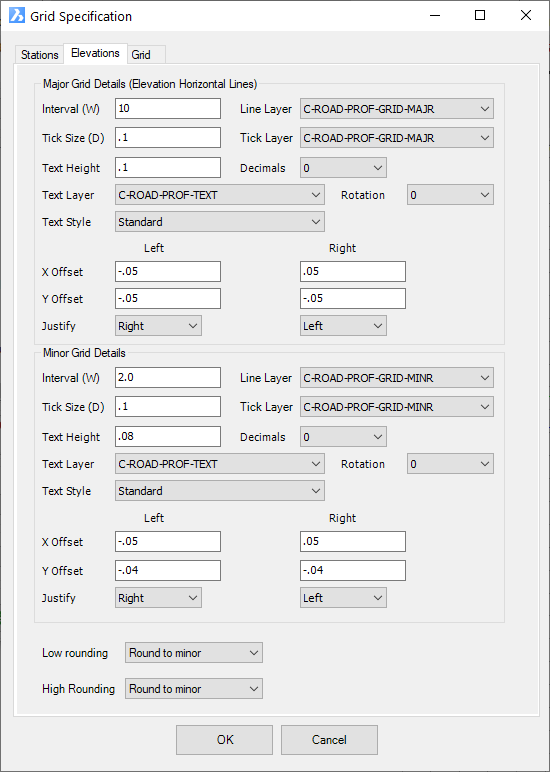
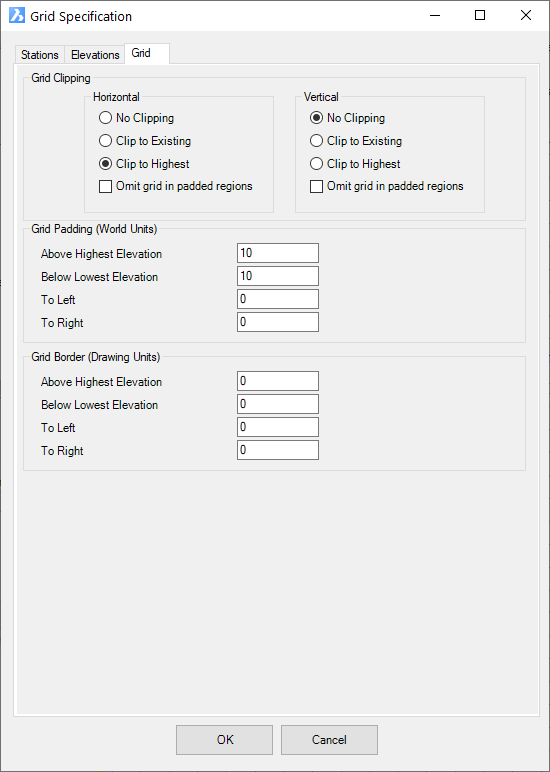
Rounding is to the Grid (major or minor)Elevations Tab - manages the vertical axes labels and grid Major Grid Details Interval Set the major grid interval Line Layer layer for the grid lines Tick size length of tick lines that extend outwards from the edge of the view frame Tick Layer layer for tick lines Text Height height of text Decimals Number of decimals to display Text Layer layer to draw the text on at each grid Rotation Text rotation - use pick list Text style select a text style x offset x offset from insertion point. Inputs are separated for Left and Right of the view frame y offset y offset from insertion point. Inputs are separated for Left and Right of the view frame Justify Set the text justification. Inputs are separated for Left and Right of the view frame Minor Grid Details Interval Set the minor grid interval Line Layer layer for the grid lines Tick size length of tick lines that extend outwards from the edge of the view frame Tick Layer layer for tick lines Text Height height of text Decimals Number of decimals to display Text Layer layer to draw the text on at each grid Rotation Text rotation - use pick list Text style select a text style x offset x offset from insertion point. Inputs are separated for Left and Right of the view frame y offset y offset from insertion point. Inputs are separated for Left and Right of the view frame Justify Set the text justification. Inputs are separated for Left and Right of the view frame Low rounding Trim the bottom (datum) to the nearest major or minor grid High rounding Trim the top of the frame to the nearest major or minor grid Grid Grid Clipping Horizontal The horizontal lines can be clipped to the existing or highest profile. Optionally omit the grid display in padded regions Vertical The vertical lines can be clipped to the existing or highest profile. Optionally omit the grid display in padded regions Grid Padding Add a padding value Above Highest Elevation enter a value Below lowest elevation enter a value To left enter a value To right enter a value Grid Border Adds and offset between the grid and the border of the profile view Above Highest Elevation enter a value Below lowest elevation enter a value To left enter a value To right enter a value
BAND AND ANNOTATION CONTROLS
Add Standard Profiles
The Standard Profiles set the display of the Design, Existing and other surface profiles in the Profile View, as well as enabling user control over the station ranges for individual sheets (overriding the controls in the Scales form.
Note: Labels can be added to the DESIGN profile by adding Profile Labels entry (see below under Annotation/Settings).
| Chainage Ranges | User control over the station ranges for creating Profile Views for a string and the top/bottom elevation controls |
| Each line represents a profile view
for the string, separated by the Station Start and End. For
each Line (Profile View) users must set the Datum (bottom of the
grid) as well as the top of the grid. Users can overlap stations
between profile views, with total control over the start and end
stations. It is possible to automatically split the profile views for a string by specifying a distance per profile view. Users still need to set the grid top and bottom elevations. 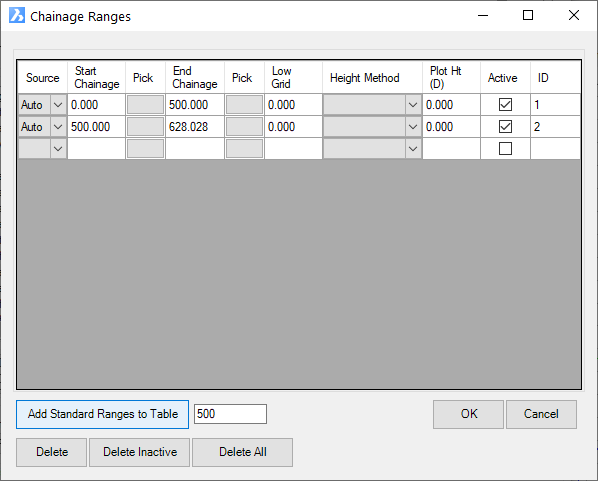 |
|
| [Table of Profile Views] | The table sets out (line by line) the profile views to create, with station ranges and elevation ranges per Profile View. |
| Source | If automatically created by specifying station range per profile view, Auto will display in this column and update when 'Add Standard Ranges to Table' button is pressed. Blank the entry to set it to manual control. |
| Start Station and Pick | Type in a start station for the profile view or click on the Pick button in the next column. |
| End Station and Pick | Type in an end station for the profile view or click on the Pick button in the next column. |
| Low Grid | Type in the elevation for the bottom of the grid |
| Height Method | Set the method for specifying the top of
the grid. Options are: - Elevation: user types in the elevation for the top of the view - # of Major Grid: this is the number of major grids to display above the top of the topmost profile displayed - # of Minor Grid: this is the number of minor grids to display above the top of the topmost profile displayed - Feet: Type in the number of feet. This will be added to the Low Grid elevation to set the top of the profile view - Inches: Type in the number of inches (this is the sheet size for plotting). This is added to the Low Grid elevation to set the top of the profile view. |
| Plot Ht | The input value is subject to the Height Method, to set the top of the Profile View |
| Active | Tick to make the profile view active and plottable |
| ID | Added by the software when Auto sheet creation is applied |
| Add Standard Ranges to Table | Click this button to automatically split into multiple profile views, with Start/End Stations as per the value specified next to this button. This add lines in the list view above, with Source set to Auto, |
| Delete | Delete the highlighted line (profie view) in the list |
| Delete Inactive | Delete any items in the list that are not set Active |
| Delete All | Clear out all set Profile Views int he list. |
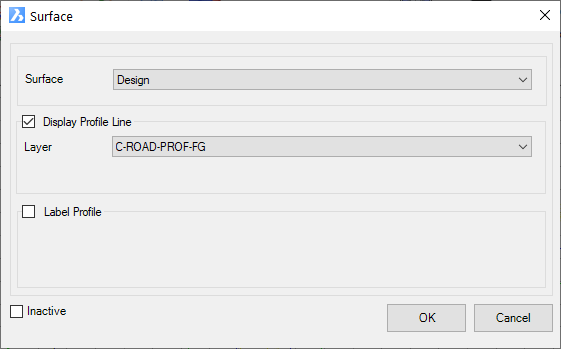
| Design Profile | Draw the Design profile in the Profile View |
 |
|
| Surface | Picklist to select a surface - this will be pre-set to Design for this entry |
| Display Profile Line | Tick on to display the profile line in the Profile View |
| Layer | Set the layer to draw the profile |
| Label Profile | Tick on to label the profile Note: For the Design Profile, labels are displayed by adding a Profile Labels entry to the output list (see below) |
| Inactive | Tick to disable display of this Profile |
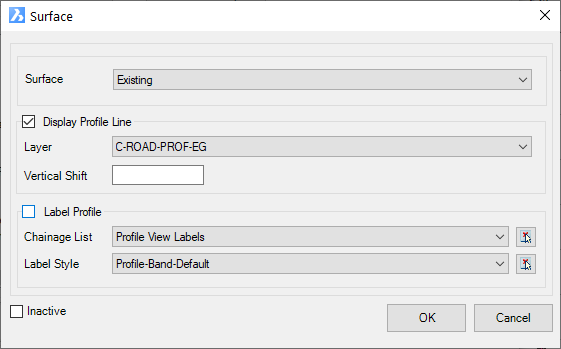
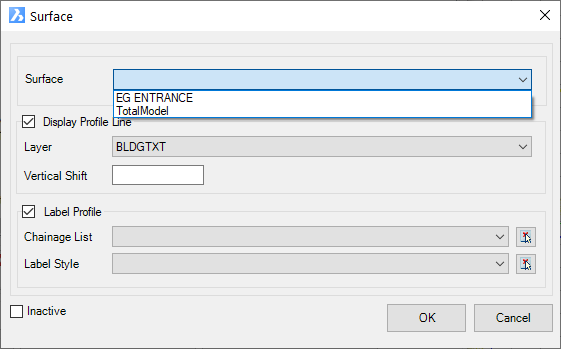
| Existing Profile | |
 |
|
| Surface | Picklist to select a surface - this will be pre-set to Existing for this entry |
| Display Profile Line | Tick on to display the profile line in the Profile View |
| Layer | Set the layer to draw the profile |
| Vertical Shift | Type in a value to mvoe the profile view up/down from the calculate position |
| Label Profile | Tick on to label the profile |
| Chainage List | Use the picklist to select a Geometry List
to apply. This sets the geometry (stations) used to
add label information on the profile Use the pick button to the right to create/edit geometry lists for the string. |
| Label Style | Pick a Label Style to use for
display of the text information at the selected stations as per
the Geometry List Use the pick button to the right to edit create/edit Label Styles. |
| Inactive | Tick to disable display of this Profile |
| Select Surface | This lets the user add any Surface as a Profile in the profile view. |
 |
|
| Surface | Picklist to select a surface |
| Display Profile Line | Tick on to display the profile line in the Profile View |
| Layer | Set the layer to draw the profile |
| Vertical Shift | Type in a value to mvoe the profile view up/down from the calculate position |
| Label Profile | Tick on to label the profile |
| Chainage List | Use the picklist to select a Geometry List
to apply. This sets the geometry (stations) used to
add label information on the profile Use the pick button to the right to create/edit geometry lists for the string. |
| Label Style | Pick a Label Style to use for display of
the text information at the selected stations as per the Geometry
List Use the pick button to the right to edit create/edit Label Styles. |
| Inactive | Tick to disable display of this Profile |
Other Profiles/Pipes
The Profiles/Pipes facilitates other display items on the profile view such as: profiles for Codes on the design cross sections, display of pipes, addition of user defined labels and a band showing the station information.
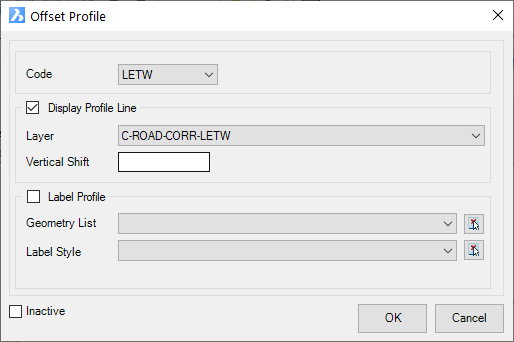
| Offset Profile | Display the Profile for a Code from the design cross sections |
 |
|
| Code | Pick the design Code (cross section code) to draw the profile line for that Code. |
| Display Profile Line | Tick on to display the profile line in the Profile View |
| Layer | Set the layer to draw the profile |
| Label Profile | Tick on to label the profile Note: For the Design Profile, labels are displayed by adding a Profile Labels entry to the output list (see below) |
| Inactive | Tick to disable display of this Profile |
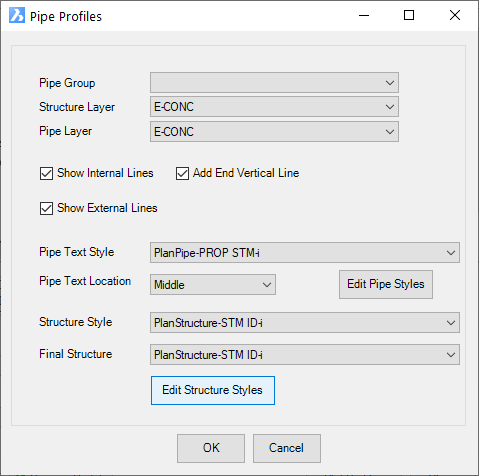
| Pipe Profiles | Project the pipes onto the profile view |
 |
|
| Pipe Group | Select the group of pipes to display. This is set using the Select Pipes to Plot command |
| Structure Layer | Pick a layer to draw the structures on |
| Pipe Layer | Pick a layer to draw the pipes on |
| Show Internal Lines | Draw the invert and obvert pipe lines |
| Show external lines | Draw the top and bottom pipe lines |
| Add End Vertical Line | Draw the end lines of the pipes |
| Pipe Text Style | Pick a Label Style to apply for the pipe text |
| Pipe Text Location | Sets the insertion point of the pipe text |
| Edit Pipe Styles | Opens the Label Style editor to set the pipe label styles to use |
| Structure Style | Pick a Label Style to apply for the structure text |
| Final Structure | A different Label Style can be applied to the end structure |
| Edit Structure Styles | Opens the Lable Style editor to set the
structure label styles to use |
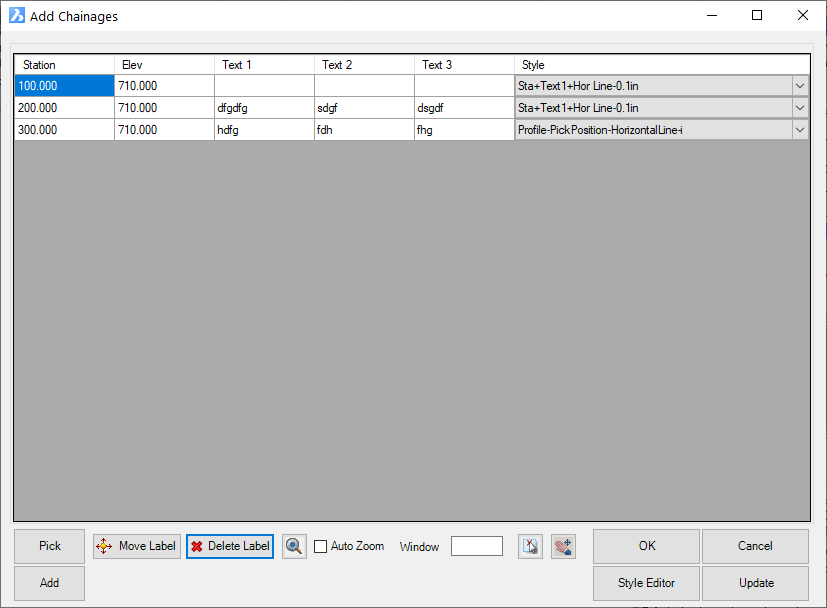
| Random Stations | Lets the user place labels onto the profile view at any selected location on the view. | ||||||||||||||||||
 |
|||||||||||||||||||
| [Table of Inputs] | Lists the inserted labels | ||||||||||||||||||
| Station | Station position for the label | ||||||||||||||||||
| Elev | Elevation position for the label | ||||||||||||||||||
| Text 1 | Optional Text input. The Label Style can be set to use this property field. | ||||||||||||||||||
| Text 2 | Optional Text input. The Label Style can be set to use this property field. | ||||||||||||||||||
| Text 3 | Optional Text input. The Label Style can be set to use this property field. | ||||||||||||||||||
| Style | Pick the label style to use to describe the position | ||||||||||||||||||
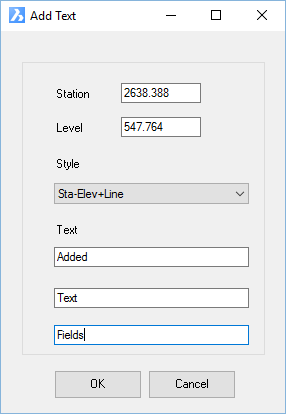
| Pick | Graphically
pick locations for adding Station/Elevation labels. Once
a position is selected, a line will display to indicate the position
and the following form will display to confirm details:
Press [Esc] to stop adding labels and return to the main form. |
||||||||||||||||||
| Add | Add a new entry in the list of labels and type in all fields. | ||||||||||||||||||
| Move Label | Enables graphical move in the drawing for the selected label in the list. | ||||||||||||||||||
| Delete Label | Delete the selected labels | ||||||||||||||||||
| Zoom to Label | Zoom in the drawing to the selected label | ||||||||||||||||||
| Auto Zoom | Tick on to auto zoom to the label as it is selected in the list. The Window value sets the size of space around the zoom point | ||||||||||||||||||
| Pick label from drawing | Allows pick of a label in the drawing, to set that label current in the label list | ||||||||||||||||||
| Zoom/Pan drawing | Allows zoom and pan in the drawing. Left click or [esc] to return to this form | ||||||||||||||||||
| Style Editor | Opens
up the Label Style editor for the selected label. This also facilitates creation of new Label Styles to use for station/elevation labels. |
||||||||||||||||||
| Update | Updates the drawing after changes are made in the form. | ||||||||||||||||||
| OK | Add profile | ||||||||||||||||||
| Cancel | Exit
without change |
||||||||||||||||||
| Stations Band | Adds a Band at the bottom of the Profile View grid to describe the station information. | ||||||||||||||||||
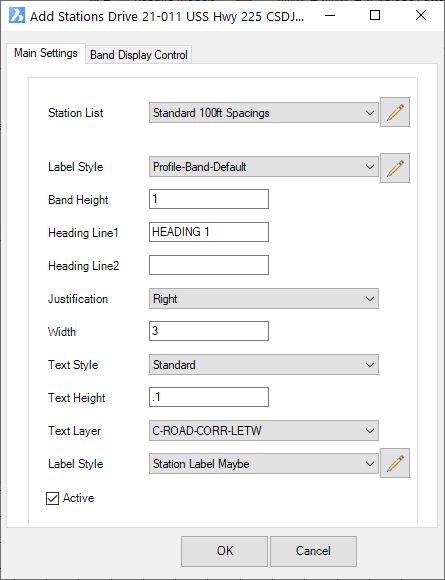 This form has two Tabs. Once controls the text information to display and where, and the other sets the linework to draw for the band itself. |
|||||||||||||||||||
| Main Settings Tab | |||||||||||||||||||
| Station List | Pick the Geometry list to set the stations where band labels are required. Use the pick button to the right to create/edit section lists. | ||||||||||||||||||
| Label Style | Sets the way text is displayed (Label Style) for the elevation/station information in the band. Use the pick button to the right to create/edit Label Styles | ||||||||||||||||||
| Band Height | Type in the height of the band | ||||||||||||||||||
| Heading Line1 | Optionally a Heading can be added to the band (displayed left of the grid) | ||||||||||||||||||
| Heading Line 2 | Optionally a Heading can be added to the band. This is an optional second line in the heading | ||||||||||||||||||
| Justification | Field not used | ||||||||||||||||||
| Width | Sets the width of the Heading | ||||||||||||||||||
| Text Style | Not used | ||||||||||||||||||
| Text Style | Not used | ||||||||||||||||||
| Text height | Not used | ||||||||||||||||||
| Text Layer | Not used | ||||||||||||||||||
| Label Style | Pick a Label Style for the display of the Heading Text. The Label Style usually would include the Properties of Heading1 and Heading2, to be populated from the above inputs. Insertion point of the heading label is to the bottom left corner of the band. | ||||||||||||||||||
| Band Display Control | |||||||||||||||||||
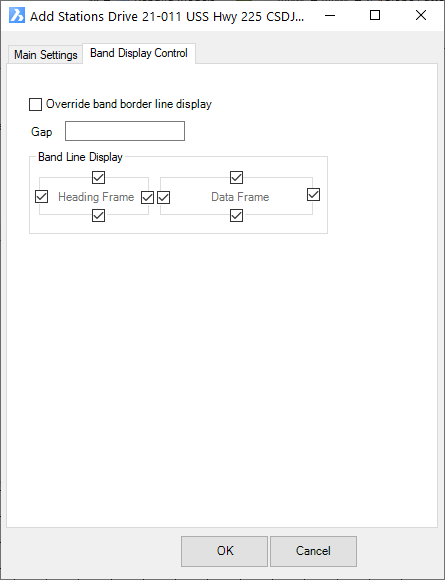 By default, the Band will show the frame for the text and the heading. This tab lets users specify what lines to draw for the band. |
|||||||||||||||||||
| Override band border line display | Tick on to control the display of the band borders | ||||||||||||||||||
| Gap | Optional gap betwen the heading and the text. This is offset left of the left side of the Profile View grid. | ||||||||||||||||||
| Band Line Display | Tick on/off the aspects of the band to display. | ||||||||||||||||||