Profile Views
Icon: |
|
| Menu: | Roads > Profile Views > Profile Views |
| Ribbon: | Roads Tab > Plan Production Panel > Profile Views Split View > Profile Views |
Introduction
This command creates USA style profile views, with or without bands at the bottom of the view frame.
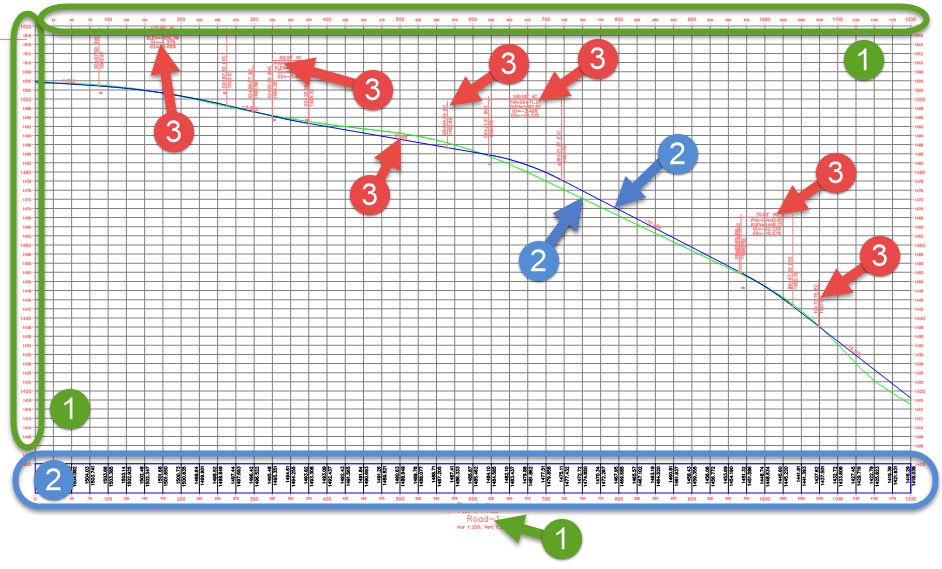
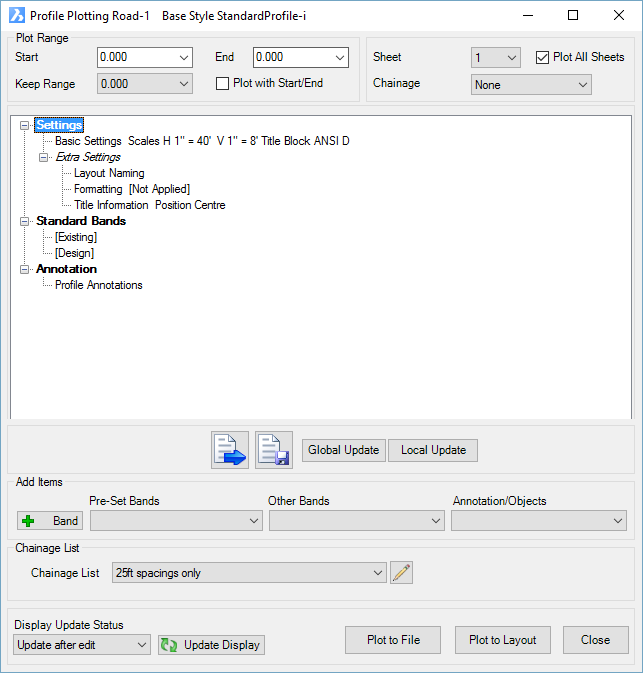
The inputs for display of the grid, profiles, bands and annotation is managed via a Treeview list of inputs, categorized by control: Settings, Bands and Annotations - this makes searching, adding and editing entries in profile view form easy. All items can be edited with a double click, whilst more mouse functionality has been incorporated with edit, delete & copy being available on the right click.
Entry items have been categorised for ease of use, making it easier to find and add items to the profile views.
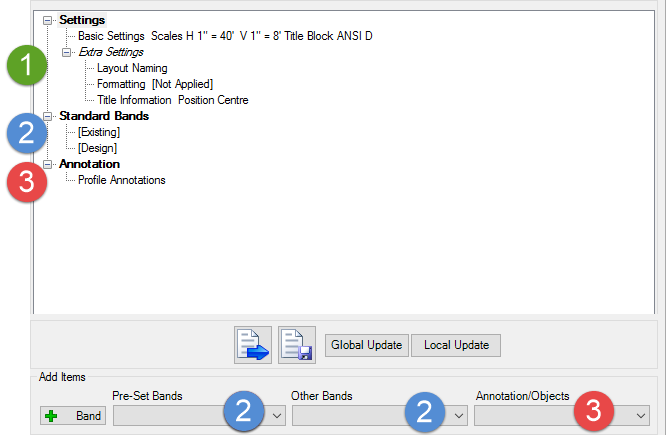
1. All settings are found at the top of the form - control grid spacing for the view, exaggeration, title, datum and output sheet names.
2. All profiles and bands are available from the new pulldown at the bottom of the form. Adding a Band controls whether to display the profile, the band at the bottom and the heading.
3. Annotations are typically associated with the design profile and are added here..
 |
 |
The Hyperlinks below can be used to jump to the relevant group of interest. FORM CONTROLS | SETTINGS | ADD BANDS AND PRE-SET BANDS | OTHER BANDS | ANNOTATIONS |
|
| | | |
Upon starting the command a new layout tab is created named Plotting Preview, and a preview of the output profile view sheets is displayed in that layout. The views in that layout are updated as the profile view plot output is edited. Each sheet can subsequently be output to individual layouts, or each sheet can be output to individual files.
General Process
- On starting the Profile View command the Designer is requested to "Select Alignment or Press Enter to Select from a List:". So either select a string (represented by an alignment or polyine) in the drawing or if you press [Enter] a list box is displayed for selection of a String to plot. Select a string and click OK, or Cancel to exit. A Selection panel enables filtering of the list to particular types of Strings.
- Following selection of a String the Profile View form will display. Details are below.
Dynamics During Editing
When the Profile View window is displayed, any edits made to the vertical grading of the string, or other edits that trigger a rebuild of the model, will result in an immediate update of the profile views presented in the Section Preview layout tab.
Annotations can be grip edited using standard CAD commands (grip edit selection, move, rotate) and will maintain repositioned locations (subject to how the label style was defined).
Navigation
Right click functionality has be added to provide access to a number of tools. Double clicking has also been added to provide quick access item edits.
Details
Profile Viewing - General
The Profile Viewer provides a great deal of flexibility in displaying cross section data. The Profile Viewer process can create a series of Layout tabs within the current drawing. Alternatively the process can create a series of separate drawing files which can be plotted or used as a external reference file (XREF).
Using the Plot Controls
 |
||
| Plot Range Controls | ||
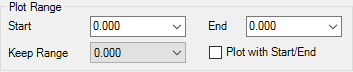 |
Start | Pick the start station to plot. This list will be limited to the start station of each sheet. |
| End | Pick the end station to plot. This list will be limited to the start station of each sheet. | |
| Keep Range | Keep the range of stations between the start and end station | |
| Plot with Start/End | Use the start and end values for the output profile view | |
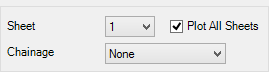 |
Sheet | Pick which sheet to view |
| Station | Select which station to view in the preview. This list will be limited to the start station of each sheet. | |
| Plot All Sheets | Pick tickbox to plot all sheets otherwise the form will plot selected sheet | |
| Load/Save Plot Style | This allows the user to save the current plotting setup as style that can be later loaded for use on other jobs. | |
| Save a copy (style set) of the current output settings. Note: All plot style settings are saved in the 'common' folder where configuration files are stored - click here for more information regarding storage of configuration files. | ||
| Load a saved plot style set from the Save Style command. | ||
| Global/Local Update | ||
| Changes made to this form will set the defaults for all new projects only | ||
| Changes made to this form will set the defaults for the current project only | ||
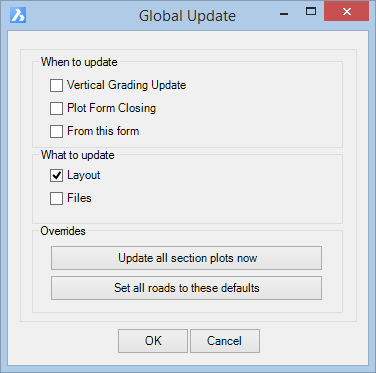 |
When to Update | |
| Vertical Grading Update | Any changes made in the Vertical Grading Editor (VGE) will automatically update the plotted view layouts / files | |
| Plot Form Closing | Any changes made in the Profile View form will automatically update the plotted cross view layouts / files | |
| From this form | Any changes made in the Global/Local update form will automatically update the plotted view layouts / files | |
| What to Update | ||
| Layout | Changes that are made to the above forms will automatically update the plotted cross section layouts | |
| Files | Changes that are made to the above forms will automatically update the plotted cross section files | |
| Overrides | ||
| Select to update all plotted section layouts / files in the current drawing | ||
| Select to set all strings to use the defaults in this form | ||
| Click ok to confirm changes made in the form | ||
| Click cancel to dismiss changes made in the form | ||
| Chainage (Station) List | Apply a named list to manage the section views that are displayed. | |
| Chainage
(Station) List |
Use the pick list
to select a Chainage (Station) list - if a list is selected, the
sections that are presented will be controlled by the named list
instead of the Selected Sections. The form is shown, below: 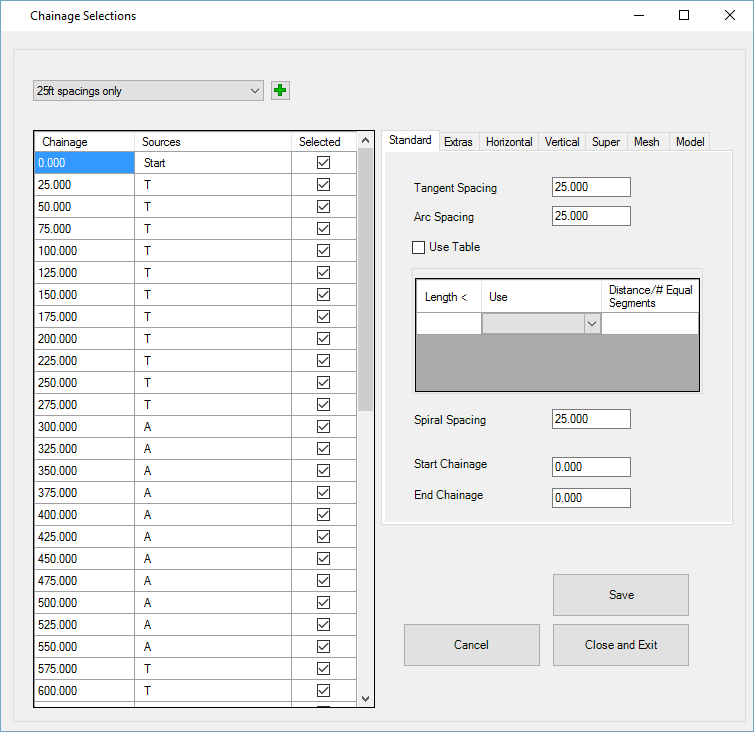 For information on creating and editing Chainage (Station) lists, see the Section Manager command. |
|
| Edit List | Select the icon to edit the selected Chainage (Station) list. | |
| Display Update Status | ||
 |
Any updates made to the Profile Viewer form will not update the preview state of the profile views. Selecting Update Display will update the preview. | |
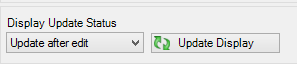 |
Any updates made to the Profile Viewer form will automatically update the preview state of the profile views. | |
| Plotting Options | ||
| This button will output the plot sheets into separate Layout tabs within the current drawing. | ||
| This button will
output the plot sheets as separate drawing files. By default, files will be generated in the same directory as the drawing file in the folder /'[drawing file name]-Data'/AdvRoads-10/Profiles unless set to a different location in the Layout Format settings form. |
||
| Exit this command without Plotting. | ||
SETTINGS, BAND AND ANNOTATION CONTROLS
Data has been grouped into settings, profile/band and annotation controls. All options are listed below in the relevant groups. Use the Hyperlinks below to jump to the relevant group of interest.
SETTINGS | ADD BANDS AND PRE SET BANDS | OTHER BANDS | ANNOTATIONS
Settings
Basic Settings
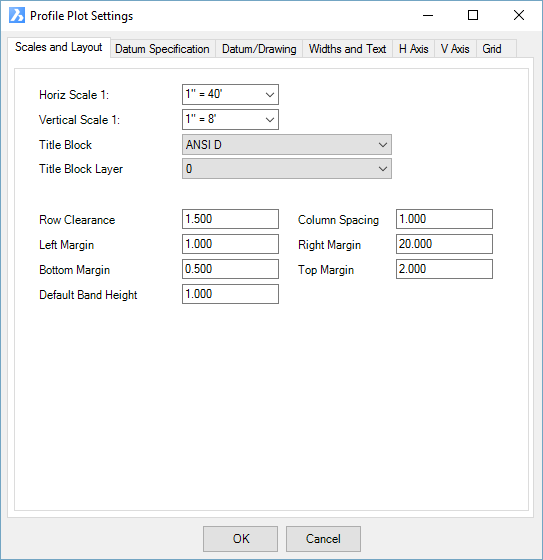
Scales and Layout
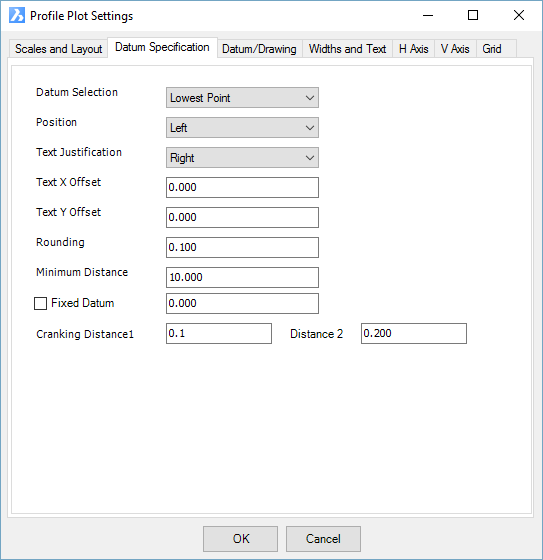
Horiz Scale 1: Input the horizontal scale of the profile views Vertical Scale 1: Input the vertical scale of the profile views Title Block Select title block to use. Title Blocks should be stored in the CSD Settings folder. The default location (which can be changed by the user) is C:\ProgramData\CSS\ARD\Common\common-10 Click here to view help on Title Blocks Title Block Layer Select the layer for the Title Block Row Clearance This is the height between each profile views row. The value is in plotted millimetres/inches. Column Spacing Spacing between columns of cross section data. BAND HEADINGS ARE IGNORED. The value is in plotted millimetres/inches. Left Margin Set the offset from the left edge of the plotting area to the start of the plotting.BAND HEADINGS ARE IGNORED. The value is in plotted millimetres/inches. Right Margin Set the minimum offset from the right edge of the plotting area to the end of the plotting. If this distance is exceeded the program will start additional tabs/drawings as required. The value is in plotted millimetres/inches. Bottom Margin Set the minimum offset from the top edge of the plotting area to the start of the plotting. The value is in plotted millimetres/inches. Top Margin Select the layer for the Title Block Default Band Height Specify the default band height. Datum and Specification Datum Selection
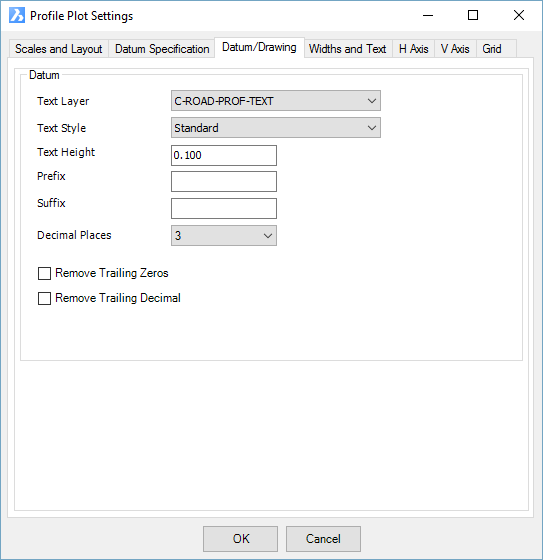
Lowest Point NS C.L. Design C.L. Position Not used Text Justification Not used Text X Offset Not used Text Y Offset Not used Rounding Not used Minimum Distance Not used Cranking Distance 1 Not used - Changes the value of the high crank. Value must need exceed the minimum distance. Cranking Distance 2 Not used - Changes the value of the low crank. Value must be less than Cranking Distance 1. Datum/Drawing Text Layer Not used Text Style Not used Text Height Not used Prefix Not used Suffix Not used Decimal Places Not used Remove Trailing Zeros Not used Remove Trailing Decimal Not used Widths & Text
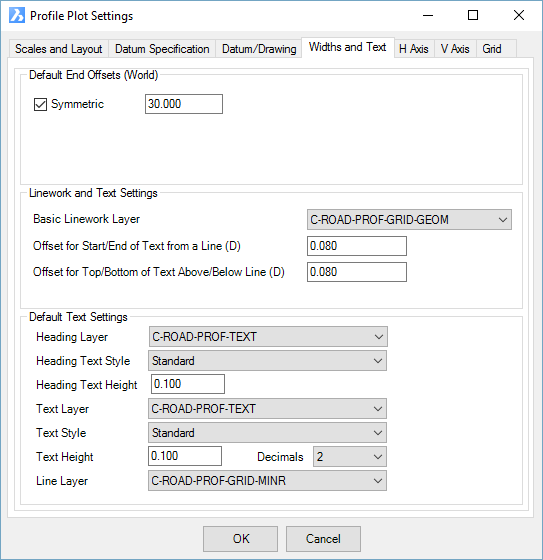
Default End Offsets This parameter has no effect on the profile views. Linework and Text Settings Basic Linework Layer Select the layer for the vertical line in the bands, when a band Label Style is not used. Offset for Start/End of Text from a Line (D) Enter a value to define where the band text is positioned vertically from the top band line (Default is 1) when a band Label Style is not used Offset for Top/Bottom of Text Above/Below Line (D) Enter a value to define where the band text is positioned horizontally from the offset line (Default is 1) when a band Label Style is not used Default Text Settings Setting these values will control default heading and band text controls Heading Layer Enter a value to define the default Heading text layer Heading Text Style Enter a value to define the default Heading text style Heading Text Height Enter a value to define the default Heading text height Text Layer Enter a value to define the default Band text layer Text Style Enter a value to define the default Band text style Text Height / Decimals Enter a value to define the default Band text height & default decimal places Line Layer Enter a value to define the default Linework layer H Axis - manages the horizontal axes labels and grid
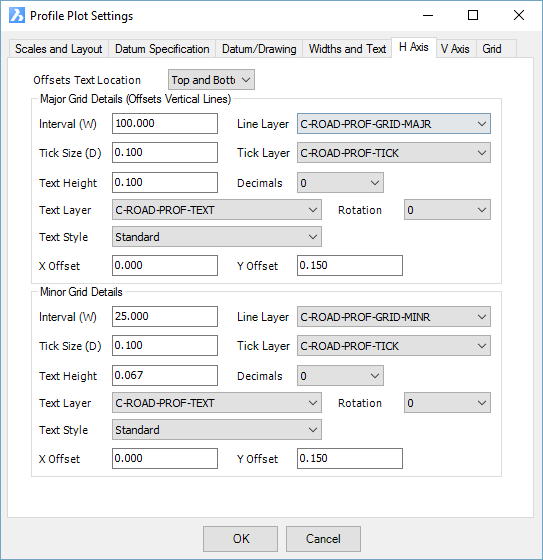
Offsets and Text Location Show grid labels top and or bottom of the grid Major Grid Details Interval Set the major grid interval Line Layer layer for the grid lines Tick size length of tick lines that extend outwards from the edge of the view frame Tick Layer layer for tick lines Text Height height of text Decimals Number of decimals to display Text Layer layer to draw the text on at each grid Rotation Text rotation - use pick list Text style select a text style x offset x offset from insertion point y offset y offset from insertion point Minor Grid Details Interval Set the minor grid interval Line Layer layer for the grid lines Tick size length of tick lines that extend outwards from the edge of the view frame Tick Layer layer for tick lines Text Height height of text Decimals Number of decimals to display Text Layer layer to draw the text on at each grid Rotation Text rotation - use pick list Text style select a text style x offset x offset from insertion point y offset y offset from insertion point V Axis - manages the vertical axes labels and grid
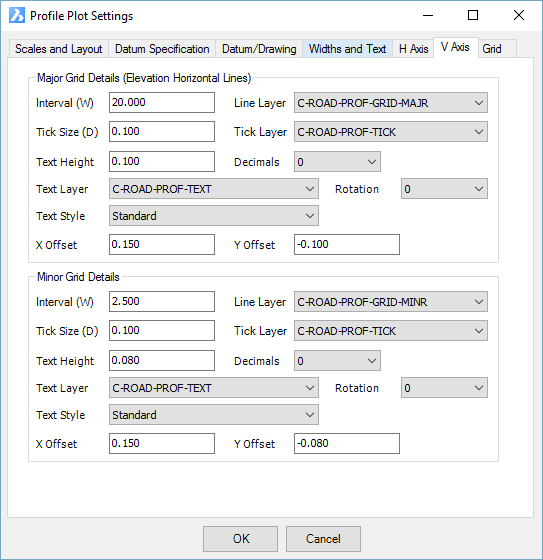
Major Grid Details Interval Set the major grid interval Line Layer layer for the grid lines Tick size length of tick lines that extend outwards from the edge of the view frame Tick Layer layer for tick lines Text Height height of text Decimals Number of decimals to display Text Layer layer to draw the text on at each grid Rotation Text rotation - use pick list Text style select a text style x offset x offset from insertion point y offset y offset from insertion point Minor Grid Details Interval Set the minor grid interval Line Layer layer for the grid lines Tick size length of tick lines that extend outwards from the edge of the view frame Tick Layer layer for tick lines Text Height height of text Decimals Number of decimals to display Text Layer layer to draw the text on at each grid Rotation Text rotation - use pick list Text style select a text style x offset x offset from insertion point y offset y offset from insertion point Grid
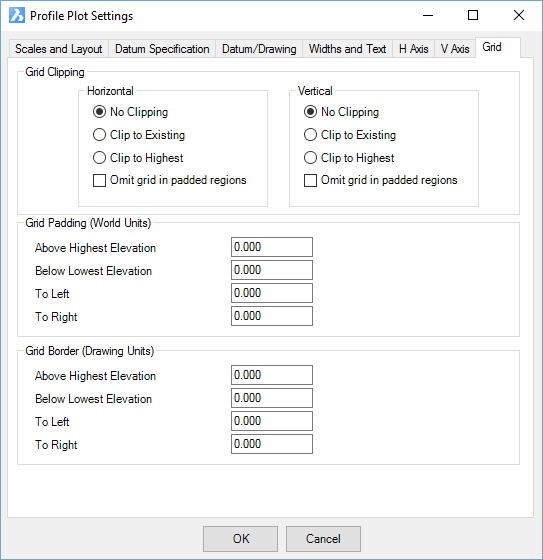
Grid Clipping Horizontal The horizontal lines can be clipped to the existing or highest profile. Optionally omit the grid display in padded regions Vertical The vertical lines can be clipped to the existing or highest profile. Optionally omit the grid display in padded regions Grid Padding Add a padding value Above Highest Elevation enter a value Below lowest elevation enter a value To left enter a value To right enter a value Grid Border Adds and offset between the grid and the border of the profile view Above Highest Elevation enter a value Below lowest elevation enter a value To left enter a value To right enter a value
Extra Settings
Layout Naming
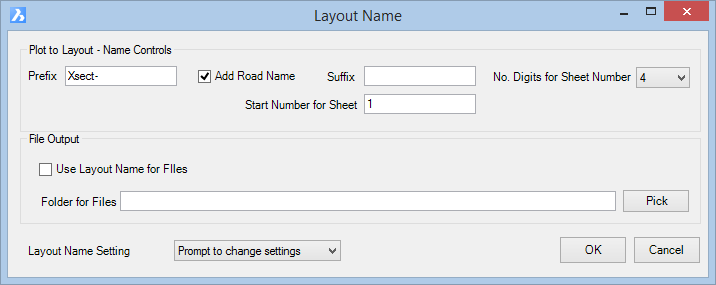
This form controls how the layout tabs are named during plottingPlot to Layout - Name Controls Prefix Enter a Prefix for the text in the layout. Add Road Name Select tickbox to include the road name in the layout name Suffix Enter a Suffix for the text in the layout. Start Number for Sheet Enter a number to define the start sheet number for the plots No. Digits for Sheet Number From the drop list provided, select the number of digits for the layout number Layout Name Setting
Use Settings Select this option to always use the settings in the form when plotting Prompt to change settings Select this option to always be prompted with this form when plotting File Output Use Layout Name for Files Select tickbox to use the layout naming for the file name Folder for Files Select Pick to choose where the Plot to File is saved. If left empty / default is the drawing -data folder.
Formatting
DO NOT APPLY FORMATTING TO THE PROFILE VIEW - inputs in this form are currently not implemented. Applying this control will result in the DATUM being set to zero.
Title Information 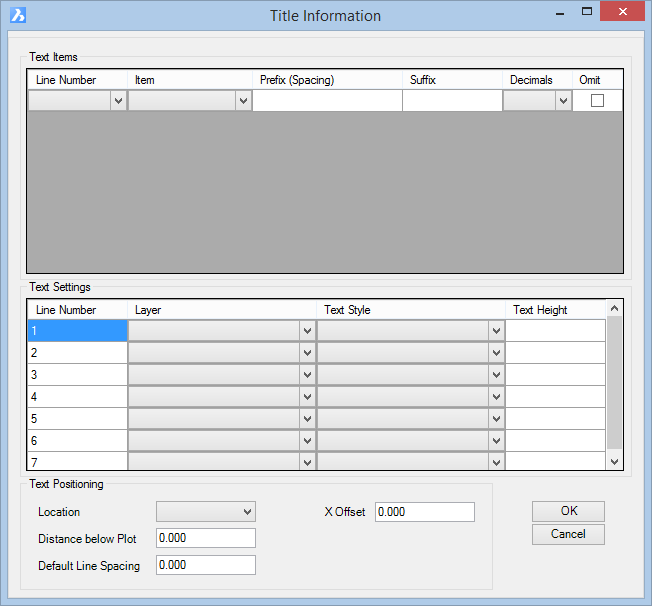
This command opens the above form where the Designer can add Title Information.
Text Items Line Number Choose the line number to assign the text content Item Choose which item to display on the line:
- Heading
- Spacing
- Horizontal Scale
- Vertical Scale
- Road NamePrefix (Spacing) Input a prefix for the start of the text content Suffix Input a prefix for the end of the text content Decimals Select the decimals be place with any numeric values Omit Tick this box to omit the line from the overall title information Text Settings Line Number Preset value representing each line of the title (not editable) Layer Select a layer for the text on the line Text Style Select a style for the text on the line Text Height Input a text height Text Positioning Location Choose which item to position the title information under the cross section
- Left
- Right
- CentreDistance below Plot Enter a value to define how far the Line 1 will be positioned underneath the cross section Default Line Spacing Enter a value to define the spacing between each title line X Offset Enter a value to move the title text on the X axis underneath the cross section
BAND AND ANNOTATION CONTROLS
Select the band and annotation controls of interest to jump to that location.
ADD BANDS AND PRE SET BANDS | OTHER BANDS | ANNOTATIONS
Add Pre-Set Bands
The Pre Set Bands automate the assignment of a Data Source by selecting a particular type of band - additionally some other items may be disabled in the form as they are not applicable to that band.
All Pre Set Bands have the same form layout - the only difference is the Data Source field, which is pre-populated based on the type of Pre-Set Band selected.
Add Pre Set Band
| This applies to all Pre Set Bands, except where noted. | |||||||||||||||||||||||||
 OVERALL CONTROLS |
|||||||||||||||||||||||||
| Control Tabs | The tabs along the top of the form provide user control over the data being applied and how it is displayed | ||||||||||||||||||||||||
| Apply | Whenever the form is edited, the Apply button can be used to update the Section Sheet display without closing the form | ||||||||||||||||||||||||
| OK | Save and apply changes | ||||||||||||||||||||||||
| Cancel | Cancel |
||||||||||||||||||||||||
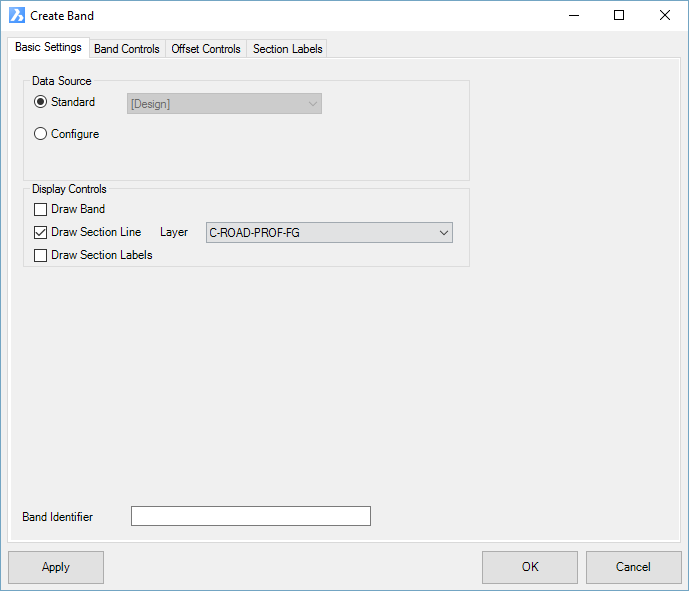
| BASIC SETTINGS TAB | |||||||||||||||||||||||||
|
|||||||||||||||||||||||||
| Data Source | This will be automatically populated based on the Pre Set band selected. | ||||||||||||||||||||||||
| Standard | Standard bands typically
do not need to be configured. Any items in square brackets,
[ ], represent data created or managed by the software. The |
||||||||||||||||||||||||
| Configure | Not used. |
||||||||||||||||||||||||
| Display Controls | Select what data to use in the bands and presented (where applicable) as section lines. Some bands require configuration. | ||||||||||||||||||||||||
| Draw Band | Tick on to draw a band (row) below or above the cross section draw window. A Band consists of a heading (optional) and offset locations where information (such as elevation, offset, code) are reported. If ticked on, the Band can be configured by the Band Controls tab and Offset Controls tab. | ||||||||||||||||||||||||
| Draw Section Line | Where a Type is selected that can be drawn (such as a surface, or design sections), this tick box will draw the section lines on the output profile views. | ||||||||||||||||||||||||
| Layer | Select a layer to draw the section lines on | ||||||||||||||||||||||||
| Draw Section Labels | Tick on to draw objects on the plotted profiles at the stations as set by the Chainage (Station) list, including text information. If ticked on, the Section Labels can be controlled by the Section Labels tab. | ||||||||||||||||||||||||
| Band Identifier | A Band Identifier can be assigned for
potential merging with other bands (not yet implemented) |
||||||||||||||||||||||||
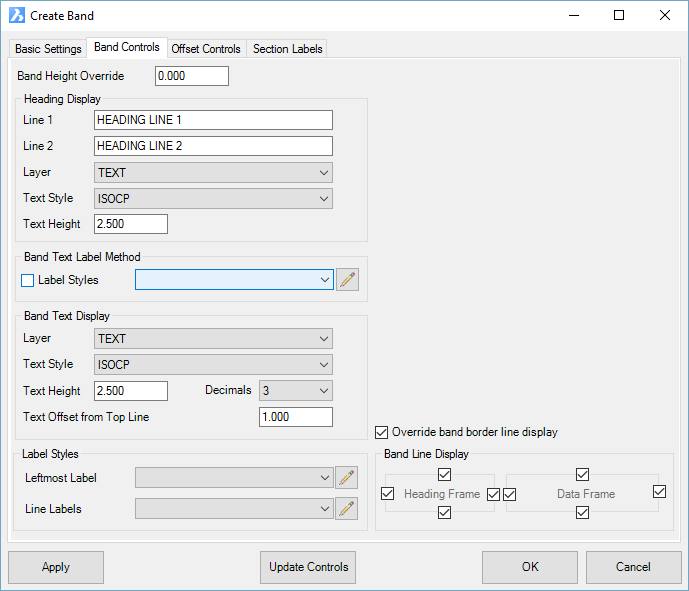
| BAND CONTROLS TAB | |||||||||||||||||||||||||
 |
|||||||||||||||||||||||||
| Row Height Override | Enter a value to override the default band height (default height specified in the Basic Settings form) | ||||||||||||||||||||||||
| Heading Display | Set the heading display controls | ||||||||||||||||||||||||
| Line 1 | Enter the Heading for the particular Data Band being entered. | ||||||||||||||||||||||||
| Line 2 | Enter the Heading for the particular Data Band being entered. | ||||||||||||||||||||||||
| Layer | From the drop list provided, select the Text layer to be used. | ||||||||||||||||||||||||
| Text Style | From the drop list provided, select the Text style to be used. | ||||||||||||||||||||||||
| Text Height | Enter the Height for the text size. | ||||||||||||||||||||||||
| Band Text Label Method | The band text can be represented as simple text, or managed by a Label Style for more control | ||||||||||||||||||||||||
| Apply Label Style | From the drop list provided, select
a Label Style to
use within the data band. Note: The label style controls differ in the following respects when applied to a Band: Text Components - additional controls for the text Insert Position - text can be inserted relative to the Top of the Band, Middle of the Band or Bottom of the Band Line Components - additional controls per entry for start position - pick From Top to be relative to top of band or From Bottom to be relative to the bottom of band |
||||||||||||||||||||||||
| |
Pick to edit the selected Label Style | ||||||||||||||||||||||||
| Band Text Display | If Apply Label Style is unticked, these text settings apply. Text is always rotated 90 degrees to be parallel with the vertical offset line that defines the offset location. | ||||||||||||||||||||||||
| Layer | From the drop list provided, select the Text layer to be used. | ||||||||||||||||||||||||
| Style | From the drop list provided, select the Text style to be used. | ||||||||||||||||||||||||
| Text Height | Enter the Height (in mm) for the text size. | ||||||||||||||||||||||||
| Decimals | From the drop list provided, select the number of decimals for the text. | ||||||||||||||||||||||||
| Text Offset from Top Line | Sets the distance of the text from the top of the band. | ||||||||||||||||||||||||
| Label Styles | If Apply Label Style is ticked, these Label Styles apply. | ||||||||||||||||||||||||
| Leftmost Label | This is an override - set a different Label Style to apply to the leftmost label (first offset on left) on each section | ||||||||||||||||||||||||
| Line Labels | This is an override
- set a different Label Style to apply to offsets that are reported
but do not originate from the data source. Note: Offsets can created by the data source, or else be reported for a different data source (a different band). If the offsets did not come from this data source, it may be desired to display it differently (eg: just a line and no text). |
||||||||||||||||||||||||
| Override band border line display | Tick on to override the display of the band borders for the heading and data. | ||||||||||||||||||||||||
| Band Line Display | Tick boxes for the top, bottom, left
and right lines of the heading and data frame can be toggled on/off |
||||||||||||||||||||||||
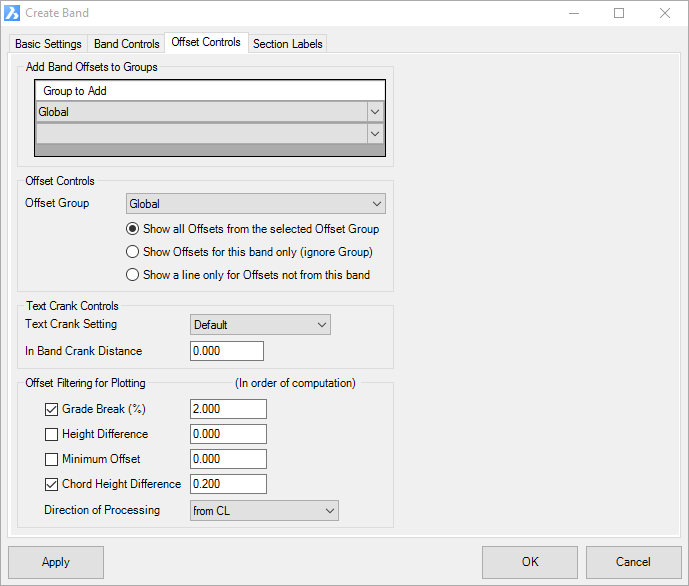
| OFFSET CONTROLS TAB | Most of these controls do not apply to Profile Views. | ||||||||||||||||||||||||
 |
|||||||||||||||||||||||||
| Add Band Offsets to Group | Not Used | ||||||||||||||||||||||||
| Group to Add | Not used | ||||||||||||||||||||||||
| Offset Controls | Not used | ||||||||||||||||||||||||
| Offset Group | Not used | ||||||||||||||||||||||||
| Text Crank Controls | Sets
how text cranking is managed. By default, cranking
occurs above the topmost band, however users can elect to add
cranking inside the current band, or ignore cranking for the current
band. The In Band Crank Distance is only applied when a band Label Style has not been applied. |
||||||||||||||||||||||||
| Text Crank Settings |
|
||||||||||||||||||||||||
| In Band Crank Distance |
|
||||||||||||||||||||||||
| Offset Filtering for Plotting | Not used | ||||||||||||||||||||||||
| Grade Break (%) | Not used | ||||||||||||||||||||||||
| Height Difference | Not used | ||||||||||||||||||||||||
| Minimum Offset | Not used | ||||||||||||||||||||||||
| Chord Height Difference | Not used | ||||||||||||||||||||||||
| Direction of Processing | Not used | ||||||||||||||||||||||||
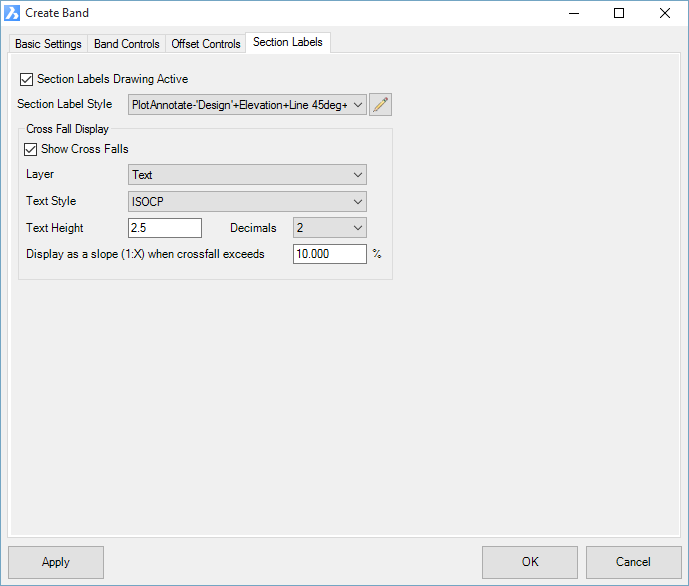
| SECTION LABELS TAB | |||||||||||||||||||||||||
 |
|||||||||||||||||||||||||
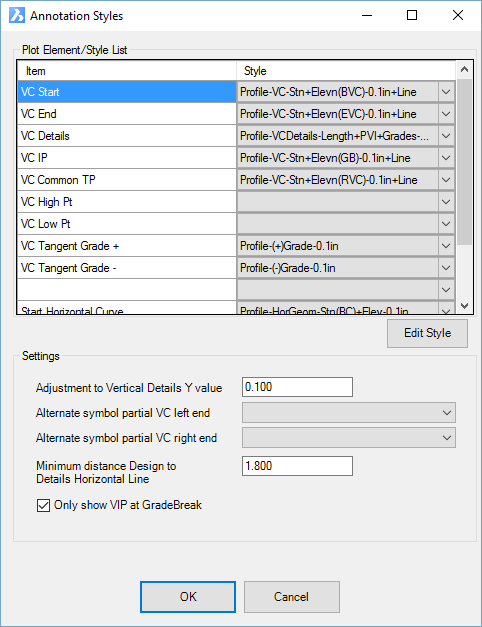
| Section Label Style | Select
a Section Label Style
to apply to the section view at the offsets. The elevation
position of these is subject to the Band Data Source selected. Label Styles can consist of Symbols (Blocks), Lines (Polylines) and Text. Text elements can include the following Items (object properties):
Refer to the Label Styles command for information on how label styles are constructed and where Text Items are applied. |
||||||||||||||||||||||||
| Show Cross Falls | This will display the incoming and outgoing grades for the profile ONLY. It is recommended to use the Annotations for labelling along the design profile. | ||||||||||||||||||||||||
| Layer | Layer to display grade | ||||||||||||||||||||||||
| Text Style | Select a text style to use | ||||||||||||||||||||||||
| Text Height | Type in a text height | ||||||||||||||||||||||||
| Decimals | Set the number of decimal places to display. | ||||||||||||||||||||||||
| Display as a slope (1:X) when crossfall exceeds | Type a % value. If this value is exceeded, then that label will display with a slope format instead of a percentage format. | ||||||||||||||||||||||||
Other Bands
| Below is listed each of the Other Bands that can be added. Typically, these bands manage overall band display and behaviour. | |||||||||
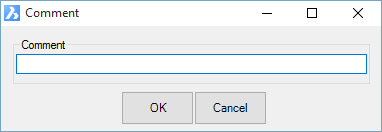
| Comment | Adds
a comment field in the Band list. Inputs as follows:
|
||||||||