Planar Check
Icon: 
Ribbon: Model Viewer > Sight Distance Tab > Planar Check
Introduction
The planar check expands on the idea of point-to-point sight distance, by instead allowing the user to set a rectangle to 'view' at the minimum sight distance, and to provide feedback on the percentage visibility to this rectangular area.
This command relies upon the user having completed Sight Distance check/s - the eye position, target position (x,y and surface) and sight distance are used to calculate the visibility.
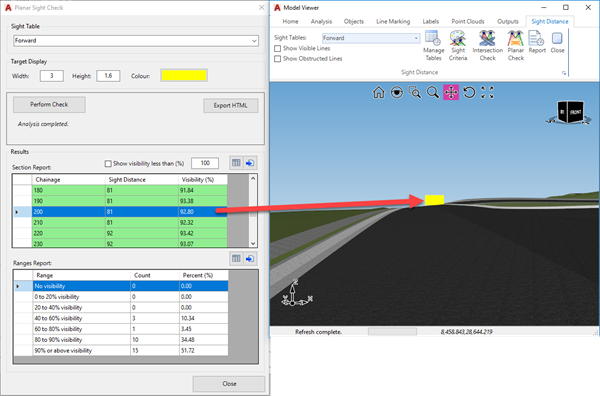
Results are viewed in the Model Viewer window. Users can toggle to a particular chainage to view the visibility results at that location.
Ribbon Tab and Navigation
The Materials Group forms part of the following tab:
![]()
Note: Click on Sight Distance in the Analysis tab to open the Sight Distance tab.
Details
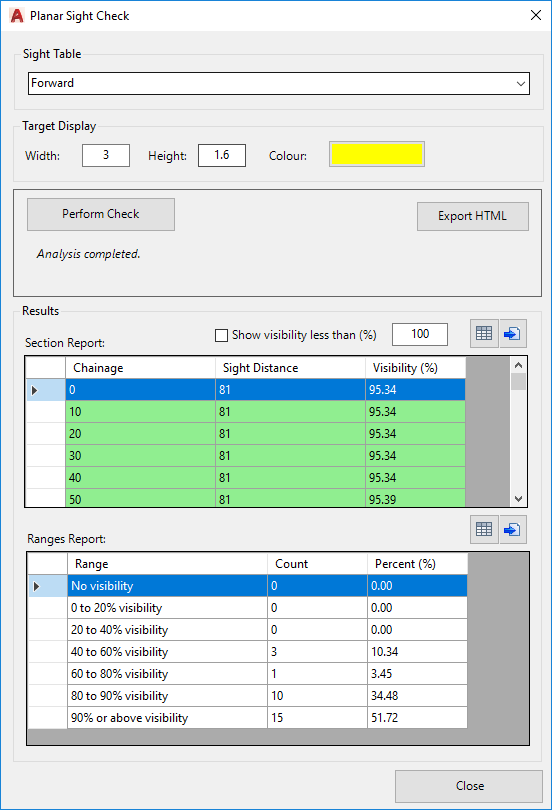
Upon selecting the command the following form is displayed:
|
|
|
|
Sight Table |
Establishes the driver, target positions and distance between |
|
Selection |
Use the dropdown to select a sight distance table |
| Target Display |
Establish the size of the target |
|
Height |
Height of rectangle |
|
Width |
Width of rectangle |
|
Colour |
Colour of rectangle |
|
Process |
Analyse the planar sight distance results |
|
Perform Check |
Will check sight distance for each cross section sampled in the Sight Distance Table |
|
Export HTML |
Creates a .xml report that opens in the default internet browser.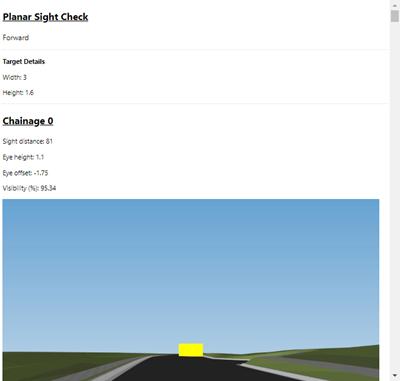 |
|
Results |
Output of calculations |
|
Section Report |
% visibility achieved per section |
|
Show visibility less than |
Tick on to limit the report to only those sections with visibility less than the value specified (bewteen 1 and 100) |
|
|
Create a Table in the drawing of the results. Pick a location in the drawing to position the table.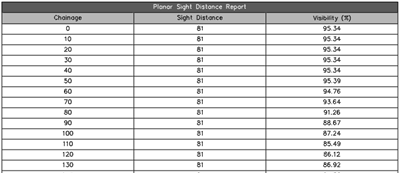 |
|
|
Create a .csv file of the results. Users are prompted for a save location and name for the file |
|
[List of results] |
Each section is analysed and the results listed here. Click on a row to display that view in Model Viewer. |
|
Ranges Report |
Summary report of the results |
|
|
Create a Table in the drawing of the results. Pick a location in the drawing to position the table.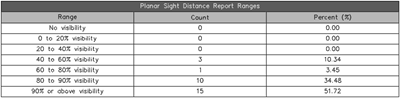 |
|
|
Create a .csv file of the results. Users are prompted for a save location and name for the file |
|
[List of results] |
The results are grouped by the % visibility range, the number of sections within that range and the % of the total that represents |
|
Close |
Close the form |
 Create Table
 Create .csv