Plot Long Sections

Icon:        


Introduction

Following any sort of road design, it is likely that there will be a need to create long section plots of the design for documentation and tendering purposes. The CSD Roads software includes the capacity to very quickly create long section plots and with full control over the design elements to plot, the plotting scales, linetypes, colours, title blocks and other customisable drafting and design outputs.

The Long Section (Profile) Plotting command provides extensive tools for the presentation of a road design long section.  Once the parameters have been set up, they can be saved as a named "style", so that they can easily be used for the other roads in the current drawing, or any other drawing.

Suggested Procedure


Initial Set Up - defining drafting output required

  1. Make a list of required layers, line types and colours required for your Longitudinal Section plots.
  2. Use the Edit Plotting Layers command to establish the layers to be used.
  3. If you have a Plot Style already defined, click on and the display will update.  If not, follow the following steps:
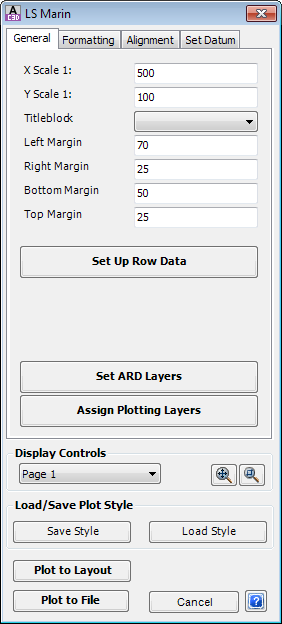
    1. Start a Long Section plot.  Select the General tab for overall layout and plotting scales.  Adjust to your anticipated needs.
    2. Click on which opens the Long Section Data Bands/Control form (as documented below) and complete the
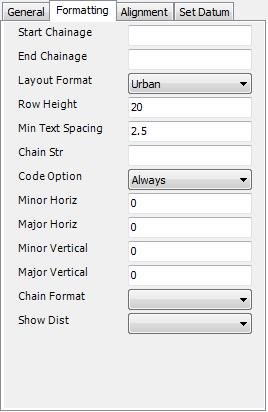
 data there.
    3. Select the Formatting tab and check the data there changing anything obvious to your requirements.
  4. Save the settings with the button as required.  An indication of the plot type and plotting scales in the file name may prove desirable e.g. Urban_500_100.

Final Setup - Suggested Procedure

  1. Plot the drawings and review the plotted output compared with your specific requirements.
  2. In most cases only a minor review of the options will be needed.
  3. If there are aspects of the plot which do not meet your needs review the documentation below for guidelines as to extra features available.  Try different settings as required.
  4. Save the settings to temporary files as you test.
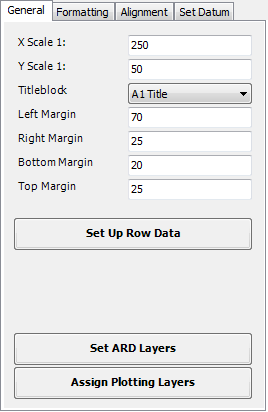
  5. When you have established a "settings set" to meet your needs save them to a permanent file, or to a series of files with variations (eg: Urban_250_50 for 1:250 horizontal scale and 1:50 vertical scale, Urban_500_100 for 1:500 horizontal scale and 1:100 vertical scale).

Finish Plotting using a saved Plot Style

  1. Start the Plot Long Sections command
  2. Select Load Style and select the required settings file.
  3. Select Plot to Layout or Plot to File to output the long sections.
 

Details

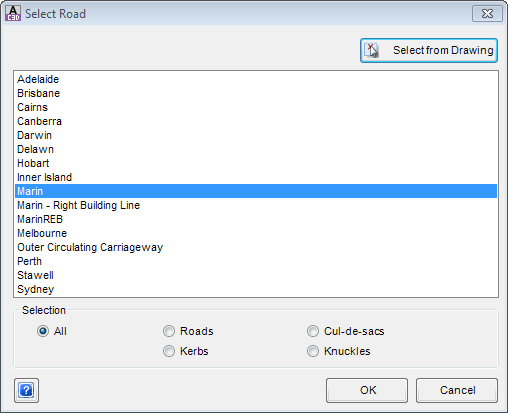
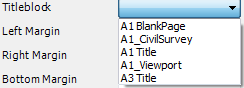
On starting the long section plot command the Designer is requested to select "Select Alignment or Press Enter to Select from a List:".  So either select a Road Object in the drawing or if you press [Enter] the list box is displayed as shown below.

List of Road Alignment Objects A list of Road Objects will appear in the main window of the form.  Initially ALL Road Objects will be displayed in this list.  Should the user want to shorten the list, select the appropriate button in the Selection options below.

The user must highlight one Road Object before picking [OK] or pick the Select from Drawing Button.

Selection The user has the ability to change the list of Road Objects by selecting the appropriate radio button.
  All Selecting ALL will show all Road Objects.
  Roads Only alignments with a 'r-' in the description field will be listed.
  Cul-de-Sacs Only alignments with a 'cds-' in the description field will be listed.
  Knuckles Only alignments with a 'n-' in the description field will be listed.
  Kerbs Only alignments with a 'k-' in the description field will be listed.
OK Apply and continue Plotting.  The user must highlight one Road Object in the abovelist before picking OK or pick the Select from Drawing Button.
Select from Drawing Return back to Model space to select the Road Object.
Cancel Exit this command without Plotting.
Help Open the Help file and display this information.

The first time a Long Section Plot is started for a Project the following forms may be opened sequentially to confirm the Civil 3D profile styles required. These are required if the user select a command that generates a Civil 3D object.  For example:  Civil3D Profiles.

Special Note: That these forms will not appear if the appropriate Styles have already been set in the Active Drawing Settings).

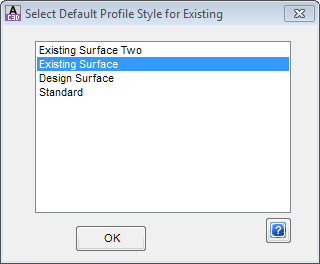
First: Select the Civil 3D Profile, Profile Style to apply to the Existing Surface, then pick [OK].

Second: Select the Civil 3D Profile, Profile Style to apply to the Design surface, then pick [OK].

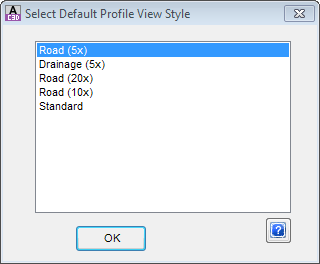
Third: Select the Civil 3D Profile View, Profile View Style to apply for the Long Section, then pick [OK].

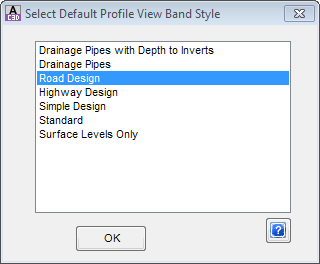
Fourth: Select the Civil 3D Profile View, Band Style to apply to the Long Section, then pick [OK].

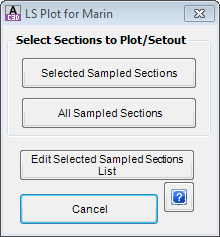
After a Road has been selected and [OK] has been pressed a form is then displayed to allow the selection of sections to be shown in the long section plot.

  Use this form to select the required sections for the profile plotting.
Selected Sampled Sections Use only the Selected Sections list previously set up for plotting.
All Sampled Sections Use All the extracted sections for plotting.
Edit Selected Sampled Sections List Select this to edit the list of chainages to use for plotting.
Cancel Exit this command without plotting.
Help Open the Help file and display this information.

After selecting either Selected Sampled Sections or All Sampled Sections, a preliminary long section is plotted into a layout tab called PlotPreview and the Long Section form, as discussed below, is opened.


Longitudinal Section Plotting - General

The Longitudinal Plotting process can create a series of Layout tabs with a section view at the bottom of the plot with an optional viewport to the relevant area of Model Space for the plan above.  The viewport can be re-sized/moved/deleted as required after the plotting command is complete.  Alternatively the process can create a series of separate drawing files which can be plotted or used as a external reference file (XREF).

The viewport is set to match the top of the plotting area - this is assumed from any Title Block that may be used (these are able to be set up via the Edit Title Block Settings command (help available from the CSD General Help System)).  When defining the plotting area for a selected Title Block this could be taken into account to save moving the viewport after plotting the output.

See the section Suggested Procedure above for generating and controlling your longitudinal (profile) section plot display.

Using the Plot Controls

After starting the command the first sheet of the Longitudinal Sections for the current Road is shown as a plot preview in the PlotPreview Layout tab.  A multi-tabbed form is displayed providing the Designer with the capability of changing all aspects of the plot appearance.  The form to control the total output is as follows:

  Click on one of the Tabs at the top of the form (General, Formatting, Alignment or Set Datum), shown left, to find out more about each tab.

  The functional buttons available from all Tabs are described below:

Display Controls This allows to user to select different pages to display if there is more than one and provides standard zoom functions.
   Pick list for selecting which Page to preview.
    Zoom Extents Click on this button to zoom to the entire sheet view.
    Zoom to Window Click on this button and then to zoom or pan in the PlotPreview use the mouse wheel.
Load/Save Plot Style This allows the user to save the current plotting setup as style that can be later loaded for use on other jobs.
   Save a copy (style set) of the current output settings.  Note: All plot style settings are saved in the 'common' folder where configuration files are stored - click here for more information regarding storage of configuration files.
   Load a saved plot style set from the Save Style command.
Plotting Options The user can either plot to Layout tabs or separate files. If any variable has been changed, the buttons in this area will be covered with an Update Display button, which must be selected before continuing.
   This button will output the plot sheets into separate Layout tabs within the current drawing.
   This button will output the plot sheets as separate drawing files.  Files will be generated in the same directory as the drawing file in the folder /'[drawing file name]-Data'/AdvRoads-10/Profiles.
    Cancel Exit this command without Plotting
    Help Open the Help file and display this information.
   This will update the preview display after making a change to the display controls.  The control does not show unless a change has been made and not Updated.


Individual Tabs


Return to Top    Return to Plot Controls


General tab

This tab enables the Designer to set the overall layout characteristics for display of cross sections in the section plot.

X Scale This sets the Horizontal scale for the plot.
Y Scale This sets the Vertical scale for the plot.
Titleblock Select a title block from the list:

The list of available files derives from the Edit Title Block Settings command (accessed from the CSD General Help).

Left Margin Set the offset from the left edge of the plotting area to the start of the plotting.  The offset is in plotted millimetres/inches.
Right Margin Set the minimum offset from the right edge of the plotting area to the end of the plotting.  If this distance is exceed the program will start additional tabs/drawings as required.  The offset is in plotted millimetres/inches.
Bottom Margin Set the offset from the bottom edge of the plotting area to the start of the plotting.  The offset is in plotted millimetres/inches.
Top Margin Set the minimum offset from the top edge of the plotting area to the start of the plotting.  The offset is in plotted millimetres/inches.
This command opens the Long Section Data Bands/Control form as documented below.  The form controls the items to be labelled in the text rows, the row labels and the precision.
This aspect of the command is described by the Edit Plotting Layers form.
This command opens the Plotting Preferences form as documented below.  The form controls the details of the text style and layers for text and linework.  The layers used here MUST be first set up in the Set CSD Layers.

Return to Top    Return to Plot Controls


Formatting tab

This tab enables the Designer to adjust the formatting of the plotted layout.

Start Chainage Set the start chainage for the long section to be plotted.  The default value is for the start of the road.
End Chainage Set the end chainage for the long section to be plotted.  The default value is for the end of the road.
Layout Format Select Urban (US is no longer used.  To achieve US format, plot the profiles through Civil 3D)
  • Urban - this suits drafting standards typically for Australia, New Zealand and parts of Europe.
  • Row Height Sets the default height in millimetres of the labelling rows.
    Min Text Spacing Set the minimum spacing between vertical leader lines such that the lines are cranked to avoid text overlap.  The value set has little effect on the finished layout.
    Chain Str Not used.
    Code Option Set to "Always".
      The following settings are ONLY applied when the Format is set to US:
    Minor Horiz Sets the spacing for the minor horizontal grid lines
    Major Horiz Sets the spacing for the major horizontal grid lines.
    Minor Vertical Sets the spacing for the minor vertical grid lines
    Major Vertical Sets the spacing for the major vertical grid lines
    Chain Format Pick list of either Normal (decimal format) or Km+ (Station Format: x+000)
    Show Dist Not used - Selecting Yes or No has no effect.

    Return to Top    Return to Plot Controls


    Alignment tab

    These items have now been mostly superseded by the ability to add and edit bands using the Surfaces tab.

    The major item on this tab is the Plan Width.  It can be used to include or exclude a plan of the road being plotted with the profile in the Layout Tab.

     
    Show Radius Select Yes or No.  If Yes is selected the Radius of the Vertical curve will be plotted under the vertical curve length.
    Plan View Width

    Typing in a value greater than 1 will result in a Model View of the road being created, matching the extents of the long section view and oriented to the angle measured between the start and end of the centreline alignment.  This is subject to Plot to Layout being selected - no model view is created if Plot to File is selected.  Leaving the field blank or typing -1, 0 or 1 will disable the model viewport creation. 

    The Plan View Width sets the width of the model view, as a distance to show left and right of the centreline alignment extents.


    Return to Top    Return to Plot Controls


    Set Datum tab

    This tab enables the Designer to adjust the formatting of the Datum label.

    Prefix Type in a prefix if required, typically R.L. or DATUM.  Add a space after the text if required.
    Suffix Type in a suffix if required, typically m.  Add a space before the text if required.
    Position Select from a list of Left or Right. The datum text is then placed on the Left or Right side of the Long Section.
    Decimal Places Select from a list of 0, 1, 2, 3 or 4 decimal places to display.  If you select 0, then a decimal point is still plotted.  If the decimal point is not needed set Trailing Decimal to No.
    Trailing Zeroes Select from a list of Yes and No to plot trailing zeroes.
    Trailing Decimal Select from a list of Yes and No to plot the trailing decimal.
    Rounding Set the level of rounding for the Datum level.  Select 1 to round to the nearest metre, or 0.5 to round to the nearest 0.5 m etc.
    Datum Selection Only one option of Lowest Point is currently available. Users can select their own datum through the "Set Datum Levels" button.
    Minimum Distance Adjust the offset of the text from the left side of the plotting area in millimetres.
    Character Height Not used - any value entered is ignored.  Now set in "Assign Plotting Layers" on the General Tab.
    Character Width Not used - any value entered is ignored.
    Font Not used - any value entered is ignored.  Now set in "Assign Plotting Layers" on the General Tab.
    Colour Not used - any value entered is ignored.  Now set in "Assign Plotting Layers" on the General Tab.
    Used to specify the datum levels when using a split datum.  The following form displays:
    Chainage Type in a chainage at which to set a new Datum level
    Datum level Type in a Datum Level to apply from the Chainage
    Auto Split for Datum Automate the process of setting Datum changes
    Maximum Distance (mm) Type in a vertical distance (measured from the top row/band).  Datums can be automatically split to keep the maximum height below this value
    Create Splits Automatically Adds Datum adjustments to the table using the Maximum Distance value
    Page Set the Datum across multiple Pages
    OK Save and apply
    Cancel Exit without saving

    Return to Top    Return to Plot Controls


    Long Section Data Bands/Controls

    This form enables the Designer to adjust the display of the long section surface data as well as the long sections (profiles) of each of the components of the road:

    The items can easily be edited or moved as required, depending on the type of plot being produced.  The information in this table is saved with the plotting data ("Save Style"), so it can be easily used for other drawings.

    Long Section Plotting Settings This contains a list of Row Data or Controls that will be plotted on each long section.  The order of the list is significant, with the item at the top of the list plotted as the first bottom row, and the last item of the list plotted at the top row.  Buttons are provided below to shuffle items up and down the list as may be required. To ADD items, click on one of the options in the Add Data Band/Control panel below.  Users can also EDIT or DELETE items.
       When this button is clicked, the highlight row in the list (above) will be moved Up one row.
       When this button is clicked, the highlight row in the list (above) will be moved Down one row.
       When this button is clicked, the highlight row in the list (above) , the form associated with this item will be opened for Editing.
       When this button is clicked, the highlight row in the list (above) will be Deleted.
    Add Data Band/Control Each button controls a set of row data that can added to each long section when plotted.  The new item will always be added to the bottom of the list.  To change its position, use the Up and Down arrows as described above.  A more detailed explanation of each Data Band or Control is provided below.
       Accept the current data and return to the plot long section form.
        Cancel Exit this command without saving.
        Help Open the Help file and display this information.


    Add Data Bands/Control

    There are a number of options for displaying row data in the Long Section.  Detailed descriptions are given below.  In all forms below the Windows Red X, OK, Cancel and Help buttons have the standard meanings and functions.

     Chainage
      

    This command opens the above form where the Designer can add a Band to show the Chainages for the Alignment.

    Heading Enter the required Heading for this item, in one or both boxes provided.
    Number of Decimal Places Select 0, 1, 2, 3 or 4 for the number of decimals places required.
    Band Height (mm) Enter a Band Height if required.  If zero is entered, the default value as set on the Formatting tab will be used.


      Vertical Grading
      

    This command opens the form where the Designer can add a Band to display. Level information (both textual and linework) relating to either the Existing or Design profiles for the Alignment.  Options allow the Designer to select 'codes' from the associated template used, or offset from the alignment.

    Select Level Method This allows the user to select from 1 of 3 methods from where the vertical grading information is derived.  Select the required toggle.
      Vertical Grading from String:  

    The first drop down box allows the Designer to select any design String, it will default to the current alignment.

    The second drop down box enables the Designer to select the the type of data to display for the selected string:

    • No VC Display - No Vertical grading is displayed;
    • Show VC and Grades - The VC lengths and Grades are shown (textual information as well as lines with arrows) above the Datum Line.
    • VC Details on Long Sections - Similar to Show VC and Grades, except that the information is provided above the profile and the information is controlled by the Vertical Text Control.  Refer to additional information below.
      Vertical Grading from Code:  

    If a profile is required along a particular code, by selecting this option the Designer can select the code and level details will be plotted as well as the profile.

      Vertical Grading at Offset:

    This will display level information and a profile based on the offset entered from the alignment.  Note: -ve for Left and +ve for Right.

    Select Surface for Levels: The user has the option to select either the Design String or another Surface.  Select the required toggle.
      Design String Click this option to display information based on the design.
      Sampled Surface Click this option to use a sample surface.  Leave it blank to use the Default surface.  Should the Designer wish to provided details against another surface, choose that form the list provided.
    Heading Enter the required Heading for this item, in one or both boxes provided.
    Layer The Plot Selection enables the Designer to select which Layer List is used for plotting the profile.  This is useful when plotting several profiles at the same time and they need to be differentiated by colour.
    Number of Decimal Places Select 1, 2 or 3 for the number of decimals places required.
    Band Height (mm) Enter a Band Height if required.  If zero is entered, the default value as set on the Formatting tab will be used.
    Height Adjustment (mm) If two profiles have similar vertical geometry, the long section maybe difficult to read.  This option will shift the profile vertically by the value entered in mm.  An additional datum value will also be displayed.
    Levels at Geometry Points Tick this box to provide additional information based on the horizontal alignment.


      Vertical Grading Levels Only
     

    This command opens the form where the Designer can add a Band to display Level (textual) information only for the selected option of String, Code or Offset.  No linework or profile is plotted, just a row containing levels.

    Select Level Method This allows the user to select from 1 of 3 methods from where the vertical grading information is derived.  Select the required toggle.
      Vertical Grading from String Select any String available from the drop down list box provided.
      Code Select any Code available from the drop down list provided and the levels details will be plotted.
      Vertical Grading at Offset This will display level information based on the offset entered from the alignment.  Note: -ve for Left and +ve for Right.
    Surface The Designer has the option to select either the Design String or the Sampled Surface.  Select the required toggle.
      Design String Click this option to display information based on the design.
      Sampled Surface Click this option to display information from the sample surface.
    Heading Enter the required Heading for this item, in one or both boxes provided.
    Number of Decimal Places Select 1, 2 or 3 for the number of decimals places required.
    Band Height (mm) Enter a Band Height if required.  If zero is entered, the default value as set on the Formatting tab will be used.


      Superelevation
     

    This command opens the above form where the Designer can add a Band to display the applied Superelevation along the Alignment.

    Heading Enter the required Heading for this item, in one or both boxes provided.
    Number of Decimal Places Select 0, 1, 2, 3 or 4 for the number of decimals places required.
    Band Height (mm) Enter a Band Height if required.  If zero is entered, the default value as set on the Formatting tab will be used.


      Horizontal Geometry
     

    This command opens the above form where the Designer can add a Band to display Horizontal Geometry information related to the Alignment.

    Heading Enter the required Heading for this item, in one or both boxes provided.
    Omit Chainage from Table The Designer can tick or untick the box provided.  When Unticked, chainages will be displayed at the all the horizontal alignment geometry.  When Ticked, the chainages will be omitted.
    Decimal Places - Length Select 0, 1, 2, 3 or 4 for the number of decimals places required, for the lengths plotted for both straights and arcs.  The bearings are included below the line.
    Decimal Places - Radius Select 0, 1, 2, 3 or 4 for the number of decimals places required, for the radius of the horizontal curves plotted.  The radius are displayed below the line.
    Decimal Places - Chainages Select 0, 1, 2, 3 or 4 for the number of decimals places required, for the Chainages if plotted.
    Band Height (mm) Enter a Band Height if required.  If zero is entered, the default value as set on the Formatting tab will be used.


      Vertical Details
     

    This command opens the above form where the Designer can add a Band to display Vertical Design details for the main Alignment.  This plots a series of angled lines and arcs mimicking the vertical design.

    Heading Enter the required Heading for this item, in one or both boxes provided.
    Band Height (mm) Enter a Band Height if required.  If zero is entered, the default value as set on the Formatting tab will be used.


      Cut/Fill Depths
    Required Offset Use this option to select how the offset is specified.  Select the required toggle.
      Vertical Grading Select any String available from the drop down list box provided.
      Code Select any Code available from the drop down list provided and the levels details will be plotted.
      Vertical Grading at Offset This will display level information based on the offset entered from the alignment.  Note: -ve for Left and +ve for Right.
    Heading Enter the required Heading for this item, in one or both boxes provided.  The Heading data is automatically populated with "Cut" and "Fill".  The Designer can change as required.
    Units for Cut/Fill Set the units to be used for cut and fill.  Select from Metres (and also set number of decimals), Millimetres or Centimetres.
    Decimal Places Select 0, 1, 2, 3 or 4 for the number of decimals places required. Needed only when Metres are selected for Units.
    Append Units to Heading Check this ON to add the units to the heading text, in the bottom (2nd) row.
    Sign Convention Select the sign convention for cut/fill.  Three options are available:

    Cut + Fill -;  Fill + Cut -;  Use Prefix Suffix Text

    Text Controls (Optional) Add optional prefix and suffix text for the cut and or fill values.  If you need to specify a space at the start or end of the text, use an underscore(_).  This is replaced by a space for plotting purposes.  The sign will also be displayed based on Sign Convention selected, unless "Use Prefix Suffix Text" has been selected.
      Cut Prefix Enter the additional text to use as a Prefix when the design is in Cut.
      Cut Suffix Enter the additional text to use as a Suffix when the design is in Cut.
      Fill Prefix Enter the additional text to use as a Prefix when the design is in Fill.
      Fill Suffix Enter the additional text to use as a Suffix when the design is in Fill.


      Cut Volumes
     

    This command opens the above form where the Designer can add a Band to display the Cut Volumes for each chainage along the Alignment.

    Heading Enter the required Heading for this item, in one or both boxes provided.
    Number of Decimal Places Select 0, 1, 2, 3 or 4 for the number of decimals places required.
    Band Height (mm) Enter a Band Height if required.  If zero is entered, the default value as set on the Formatting tab will be used.


      Fill Volumes
     

    This command opens the above form where the Designer can add a Band to display the Fill Volume for each chainage along the Alignment.

    Heading Enter the required Heading for this item, in one or both boxes provided.
    Number of Decimal Places Select 0, 1, 2, 3 or 4 for the number of decimals places required.
    Band Height (mm) Enter a Band Height if required.  If zero is entered, the default value as set on the Formatting tab will be used.


      Offsets
     

    This command opens the above form where the Designer can add a Band to display the Offsets for each chainage along the Alignment.

    Select Offset Method Use this option controls to select how the offset is specified.  Select the required toggle. Note: Please ensure that you select an item from the list for either option, otherwise extraneous data will be plotted.
      Vertical Grading Select any String available from the drop down list box provided.
      Code Select any Code available from the drop down list provided and the levels details will be plotted.
    Heading Enter the required Heading for this item, in one or both boxes provided.
    Number of Decimal Places Select 0, 1, 2, 3 or 4 for the number of decimals places required.
    Band Height (mm) Enter a Band Height if required.  If zero is entered, the default value as set on the Formatting tab will be used.


      Distance
     

    This command opens the above form where the Designer can add a Band to display the Distance between each selected section for plotting along the Alignment.

    Heading Enter the required Heading for this item, in one or both boxes provided.
    Number of Decimal Places Select 0, 1, 2, 3 or 4 for the number of decimals places required.
    Band Height (mm) Enter a Band Height if required.  If zero is entered, the default value as set on the Formatting tab will be used.


      Point Numbers
     

    This command opens the above form where the Designer can add a Band to display the Point Numbers for each selection section for plotting along the Alignment, provided the Set-Out command has been used.  The point numbers are obtained by matching the centreline co-ordinates with co-ordinates in the set out file.  This means that a setout using the C.L. code MUST have been computed PRIOR to plotting a profile containing the Point Numbers.  It also means that you need to be extremely careful to make sure that you check that the numbers in the profile plot do correctly match the set out numbers.  If there is any change to the design, then this may not be the case, so only use this option on a profile plot AFTER the setout has been completed for safety.  This is useful for Kerb Returns Long Sections.

    Heading Enter the required Heading for this item, in one or both boxes provided.
    Band Height (mm) Enter a Band Height if required.  If zero is entered, the default value as set on the Formatting tab will be used.


      Hatching
     

    This command allows the user to apply hatching between the existing and design surface with separate patterns for cut and fill.

    Vertical Grading Select any String available from the drop down list box provided (generally the current road profile).
    Surface Select required surface (generally current existing surface)
    Fill Pattern Select from the drop down list. Alternatively, create a file "hatchingPats.txt" in the common folder and type in (one per line), the list of hatch patterns to use.
    Fill Scale Enter a suitable scale.  If the scale is incorrect, there will be too much hatching and it will be very slow.
    Fill Layer Select the Layer for the fill pattern.
    Cut Pattern Select from the drop down list.  Alternatively, create a file "hatchingPats.txt" in the common folder and type in (one per line), the list of hatch patterns to use.
    Cut Scale Enter a suitable scale.  If the scale is incorrect, there will be too much hatching and it will be very slow.
    Cut Layer Select the Layer for the cut pattern.


      Cross Section Numbers
     

    This command opens the above form where the Designer can add a Band to display the Cross Section Numbers for the selected sections for plotting along the Alignment.  This option matches the chainages in the profile plot with the chainages LAST plotted as sections.  Be extremely careful to update the profile plot IF the cross section plot is redone, to make sure that the chainages match properly.

    Heading Enter the required Heading for this item, in one or both boxes provided.
    Band Height (mm) Enter a Band Height if required.  If zero is entered, the default value as set on the Formatting tab will be used.


      Hectometres
     

    This command opens the above form where the Designer can add a Band to display the Hectometres distance along the Alignment.

    Heading Enter the required Heading for this item, in one or both boxes provided.
    Number of Decimal Places Select 0, 1, 2, 3 or 4 for the number of decimals places required.
    Band Height (mm) Enter a Band Height if required.  If zero is entered, the default value as set on the Formatting tab will be used.


      Title Information

    This command opens the above form where the Designer can add Title Information below the Data Bands for the Long Section.

    Position Select required the toggle for the Title position: Left, Centre or Right.  The default location is set relative to the bottom of the bottom row of the Long Section Plot.
    Offsets Nominate an offset (in mm) for the Title Information Label text to be moved in the X and Y direction as may be required.  Note: For the X Offset, -ve for Left and +ve for Right. Any value in the Y Offset will move the Title down.
    Details Check on the items to be shown in the Titles text. For most items, a prefix and a suffix can be included. Use the underscore (_) to achieve a space.  It is replaced by a space when plotted.  There are options to start new lines, to help separate the information.
      Initial Text  Add in some initial text that may describe the long section.  For example: Road Long Section, Kerb Return.
      Start New Line Tick this box, to start the Road Name and any following information on a new line to display it below the Initial Text.
      Show Road Name Tick the box to add in the Alignment name as part of the title information.  There are options to add a Prefix and or a Suffix to this item.
      Show Start Chainage Tick the box to add in the Start Chainage as part of the title information.  There are options to add a Prefix and or a Suffix to this item.  Note this item will placed on the same line as the Road Name.
      Show End Chainage Tick the box to add in the End Chainage as part of the title information.  There are options to add a Prefix and or a Suffix to this item.  Note this item will placed on the same line as the Road Name.
      Start New Line Tick this box, to start the Scale information on a new line to display it below the Initial Text or Road Name.
      Show Horizontal Scale Tick the box to add in the Horizontal Scale as part of the title information.  There are options to add a Prefix and or a Suffix to this item.
      Show Vertical Scale Tick the box to add in the Vertical Scale as part of the title information.  There are options to add a Prefix and or a Suffix to this item.   Note this item will placed on the same line as the Horizontal Scale.


      Intersection Detail

    This command opens the above form where the Designer can add Intersection Details above the Profile linework.

    Details to Display This allows for up to four (4) items to be added to describe information relating to the intersecting road alignment.  Use the underscore (_) to achieve a space and it will be replaced when plotted.
      Item From the drop down list, select from: Side Road Name, Side Road Chainage, Main Road Chainage, Elevation.  Should a item need to be removed, select the 'blank' item.
      New Line Tick this box, should the 2nd, 3rd or 4th Item be required on separate lines.
      Prefix Enter an optional Prefix for the Item.
      Suffix Enter an optional Suffix for the Item.
      Number of Decimals Select 0, 1, 2, 3 or 4 for the number of decimals places required.
    Text Line Settings This part controls position, layers and font for the Intersection Detail Text and linework.
      Line Length Above (mm) Enter the length of the line to be drawn (in mm) upwards starting from the design surface.
      Line Length Below (mm) Enter the length of the line to be drawn (in mm) downward starting from the design surface.
      Line Layer Select the layer for this line to be drawn on, from the drop list provided.
      Text X Offset (mm) Enter a X offset (in mm) to shift the starting point for the textual information.  Note: -ve for Left and +ve for Right.
      Text Y Offset (mm) Enter a Y offset (in mm) to shift the starting point for the textual information.  Note: -ve for Down and +ve for Up.
      Text Angle Enter the Angle (in decimal degrees) to rotate the textual information.
      Text Font From the drop list provided, select the Text Font style to be used.
      Text Layer Select the layer for this text to be drawn on, from the drop list provided.
      Text Size Enter the Height (in mm) for the text size.
      Text Origin Horizontal From the drop list provided, select either Left, Middle or Right to control the horizontal start position of the text.
      Text Origin Vertical From the drop list provided, select either Bottom, Middle or Top to control the vertical start position of the text.


      Pipes

    This command opens the above form where the Designer can display CSD Pipes within the Long Section.

    Maximum Left Offset Enter the maximum offset to 'search' for CSD Pipes to added onto the Long Section.  Negative for Left of the centreline.
    Maximum Right Offset Enter the maximum offset to 'search' for CSD Pipes to added onto the Long Section.  Positive for Right of the centreline.
    Layer Select the Layer to place the pipe objects from the drop list provided.
    Crossing Option Select how much of the pipe to display.  Three (3) options are available from the drop list:
    • Just Crossing Point
    • Both Ends
    • Both Ends and Crossing


      Plotted Length Override

    This command opens the above form which gives the Designer some override controls for the plotted length of the Long Section Profile.

    Drawing Length (mm) Enter the total drawing length in millimetres for the Long Section, including the heading box.
    Overlap Distance (m) Enter an overlap distance allowed in metres.


      Heading Controls

    This command opens the above form which gives the Designer default controls for the Heading Box to the Data Bands.

    Text Justification Select whether the text in the heading box area is Left, Centre or Right justified.
    Frame Length (mm) Enter the Frame Length for the Heading Box.  Enter 0 for the default.
    Offset from Frame (mm) Enter an offset for the text from the frame.
    Show Sample Lines Tick this box to add a Sample Line within the Heading Row for each relevant Data Band matching the Profile style.


      Vertical Text

    This command opens the above form which gives the Designer controls for the information displayed for various vertical grading information above the data bands or on the vertical grading design profile.

    Text below Vertical Grading This controls the Prefixes for the various items related to Vertical Grading displayed above the Data Bands, when 'Show VC and Grades' is selected 'Vertical Grading' button.
      IP Enter a Prefix, if desired, in the text box provided for the Vertical Intersection Point Level, then select 0,1,2,3,4 for the number of decimals places required for the numerical value.
      VC Length Enter a Prefix, if desired, in the text box provided for the Vertical Curve Length, then select 0,1,2,3,4 for the number of decimals places required for the numerical value.
      Grade Enter a Prefix, if desired, in the text box provided for the Vertical Grade, then select 0,1,2,3,4 for the number of decimals places required for the numerical value.
      Radius Enter a Prefix, if desired, in the text box provided for the Vertical Radius, then select 0,1,2,3,4 for the number of decimals places required for the numerical value.
      Crest Chainage Enter a Prefix, if desired, in the text box provided for the Crest Chainage, then select 0,1,2,3,4 for the number of decimals places required for the numerical value.
      Crest Level Enter a Prefix, if desired, in the text box provided for the Crest Level, then select 0,1,2,3,4 for the number of decimals places required for the numerical value.
      Sag Chainage Enter a Prefix, if desired, in the text box provided for the Sag Chainage, then select 0,1,2,3,4 for the number of decimals places required for the numerical value.
      Sag Level Enter a Prefix, if desired, in the text box provided for the Sag Level, then select 0,1,2,3,4 for the number of decimals places required for the numerical value.
    Text on Vertical Grading This controls the Prefixes for the various items related to Vertical Grading displayed above the Profile, when 'VC Details on Long Section' is selected 'Vertical Grading' button. A Plot Sequence number is required to determine each items location in the list.  1 to be at the top of the list and 8 to be at the bottom of the list.  If the item is not required, select 0 for that item and it will be omitted.
      Chainage Enter a Prefix, if desired, in the text box provided for the Chainage of Vertical Intersection Point, then select 0,1,2,3,4 for the number of decimals places required for the numerical value and then a Plot Sequence number from 1 to 8.
      Length Enter a Prefix, if desired, in the text box provided for the Vertical Curve Length, then select 0,1,2,3,4 for the number of decimals places required for the numerical value and then a Plot Sequence number from 1 to 8.
      Grade In Enter a Prefix, if desired, in the text box provided for the Vertical Grade In, then select 0,1,2,3,4 for the number of decimals places required for the numerical value, and then a Plot Sequence number from 1 to 8.
      Grade Out Enter a Prefix, if desired, in the text box provided for the Vertical Grade Out, then select 0,1,2,3,4 for the number of decimals places required for the numerical value, and then a Plot Sequence number from 1 to 8.
      Grade Change Enter a Prefix, if desired, in the text box provided for the Change in Vertical Grade, then select 0,1,2,3,4 for the number of decimals places required for the numerical value, and then a Plot Sequence number from 1 to 8.
      Secant Height Enter a Prefix, if desired, in the text box provided for the Secant Height, then select 0,1,2,3,4 for the number of decimals places required for the numerical value, and then a Plot Sequence number from 1 to 8.
      Secant Length Enter a Prefix, if desired, in the text box provided for the Secant Length, then select 0,1,2,3,4 for the number of decimals places required for the numerical value, and then a Plot Sequence number from 1 to 8.
      Radius Enter a Prefix, if desired, in the text box provided for the Radius of the Vertical Curve, then select 0,1,2,3,4 for the number of decimals places required for the numerical value, and then a Plot Sequence number from 1 to 8.


      Cut/Fill on Profile

    This command opens the above form which gives the Designer controls for the display of Cut and Fill information on the vertical grading design profile.

    General This provides control for two basic items common to both Cut and Fill settings.
      Units From the drop box provided, select the required units. Options are: Metres, Decimetres, Centimetres and Millimetres
      Decimal Places for Units Select 0, 1, 2, 3 or 4 for the number of decimals places required.
    Cut Settings This section allows the Designer to control how the Cut Settings information will be displayed. The Cut Settings Text is displayed BELOW the profile line. Similar controls are provided for Fill Settings.
      Layer Select the layer for this text to be drawn on, from the drop list provided.
      Text Style From the drop list provided, select the Text Font style to be used.
      Text Height (mm) Enter the Text Height (in mm) for the text size.
      Distance Below Profile (mm) Enter distance (in mm) to move the starting point for the textual information away from the profile line.
      Horizontal Offset Enter a Horizontal Offset (in mm) to shift the starting point for the textual information.  Note: -ve for Left and +ve for Right
      Prefix Text Enter an optional Prefix for this Text Item.
      Suffix Text Enter an optional Suffix for this Text Item.
      Sign Select the sign convention for cut settings. Three options are available: + - None
      Angle Enter the Angle (in decimal degrees) to rotate the textual information.
      Cranking This provides control over the placement of the textural information, if the section lines have been cranked. Three options are available: Use Cranked location, Use Uncranked Location or Omit if Cranked.
    Fill Settings This section allows the Designer to control how the Fill Settings information will be displayed. The Fill Settings Text is displayed ABOVE the profile line. The information and control are identical to the Cut Settings, please refer this section above.


      Tabulate Super

    This control allows the user to generate a Table of the Superelevation applied to the Long Section.

    Labels for Plotting Enter the required Labels for this item, in one or both boxes provided.
    Heading Layer Select the layer for this heading text to be drawn on, from the drop list provided.
    Heading Font From the drop list provided, select the Heading Text Font style to be used.
    Heading Size Enter the Heading Text Height (in mm) for the text size.
    Side Select from a list of Left or Right to place the Superelevation Table on that side of the Long Section.
    Layer Select the layer for this text to be drawn on, from the drop list provided.
    Font From the drop list provided, select the Text Font style to be used.
    Text Height Enter the Text Height (in mm) for the text size.
    Sign Convention Select either toggle to control whether Down is reported as negative or positive.
    Decimal Places Select 0, 1, 2, 3 or 4 for the number of decimals places required.
    Row Height Enter a Row Height in millimetres.


      Widths

    This control allows the user to generate a Table of the Widths based on Alignments, Codes or simply offsets.

    Text Definition This section provides controls of the data text fields.  Such controls are for Layer, Style, Size, Prefix and Suffix, decimals and row height.
      Text Layer Select the layer for this text to be drawn on, from the drop list provided.
      Text Style From the drop list provided, select the Text Font style to be used.
      Text Height (mm) Enter the Text Height (in mm) for the text size.
      Prefix Text Enter an optional Prefix for this Text Item.
      Suffix Text Enter an optional Suffix for this Text Item.
      Decimal Places Select 0, 1, 2, 3 or 4 for the number of decimals places required.
      Row Height Enter a Row Height in millimetres.
    Heading Definition This section provides controls of the Heading text fields.  Such controls are for Layer, Style and Size
      Heading Line 1 Enter the text for the Heading for Line 1.
      Heading Line 2 Enter the text for the Heading for Line 2.
      Heading Layer Select the layer for this heading text to be drawn on, from the drop list provided.
      Heading Style From the drop list provided, select the Heading Text Font style to be used.
      Text Height (mm) Enter the Text Height (in mm) for the text size.
    Point 1 This provides 3 ways to define the first point code to display for width.  Select the required toggle.  Similar controls are provided for Point 2.
      Alignment The width can be defined from an alignment.  From the drop down box select any Alignment in the current drawing.
      Label The width can be displayed based on a particular code.  From the drop box provided select the required label.
      Offset The width can be set by entering an offset from the alignment.  Note: -ve for Left and +ve for Right.
    Point 2 This provides 3 ways to define the second point code to display for width.  The controls used are the same Point 1, refer above.

    Return to Top    Return to Plot Controls


    Plotting Preferences (from Assign Plotting Layers button)

    This form enables the Designer to set the layers and text styles to be used in the section plot.

    The top line of data is the default data and Designers can set data in this line and then use the Set Fonts to Default and Set Text Size to Default to apply those settings to all items in the column.

    Item Table

    A list of items for which settings data can be edited.  Each Item correlates with a part of the long section.  Some Item's only have either lines or text describing them - users can set the controls for the display of the lines and text associated with each Item.  For each Item the Designer can assign the following drafting controls
      Font Select a Font Style from the drop down list of Text Styles derived from the Fonts.txt file.
      Text Size Key in the required plot height of the text in millimetres, assuming a 1:1 plot scale.
      Text Layer Select a layer from the drop down list of layers to place text for the respective Item.
      Line Layer Select a layer from the drop down list of layers to place lines for the respective Item.
    Apply and Exit To accept and apply changes and exit.
    Set All Fonts to Default Upon pressing this button, all Font Styles will be reset to match that set in the Default value in the first row.
    Set All Text Size to Default Upon pressing this button, all Text Size will be reset to match that set in the Default value in the first row.
    Set Plotting Layers This will open a new window containing a Layer List.  This aspect of the command is described by the Edit Plotting Layers form.
      Cancel Exit this form without changing data.
      Help Open the Help file and display this information.