Cross Section Plots
Icon: |
|
Introduction
This command is used to generate section plots of strings and models, suitable for plotting and final drafting output. This command supersedes the Plot Cross Sections (Legacy) command.
This command features significant enhancements in filtering band offset labels, more control over label display output, inclusion of user managed offsets based on CAD objects such as lines and polylines, and the ability to comprehensively annotate information on the section display including blocks. Additionally, Cross Section Plot outputs can be set to dynamically update as changes are made to the design.
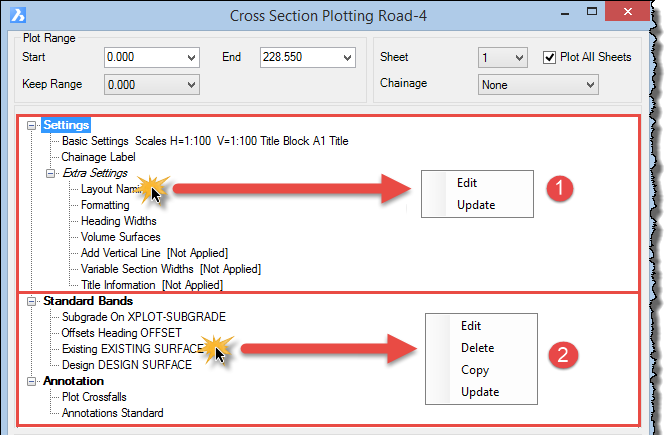
The Treeview means that adding and editing entries in the cross section form is all achieved on the single screen. All items can be edited with a double click, whilst more mouse functionality has been incorporated with edit, delete & copy being available on the right click.
Entry items have been categorised for ease of use, making it easier to find and add items to the cross sections.
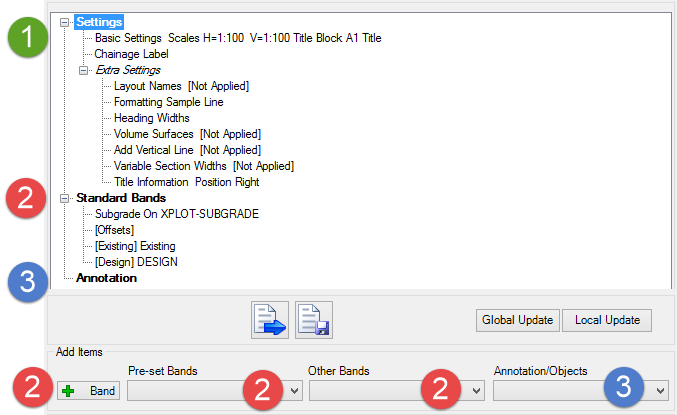
1. All settings are now found at the top of the form, the user can choose to apply extra settings where appropriate, these include varying the section widths to removing the band heading borders.
2. All standard bands (typically used on cross sections) are available from the new pulldown at the bottom of the form. Less frequently used bands, such as codes & tagged objects are available in the Other Bands pulldown.
3. Any annotation or objects that are to be shown above the datum line are added from this new section of the form.
 |
 |
|
The Hyperlinks below can be used to jump to the relevant group of interest. FORM CONTROLS | SETTINGS | ADD BANDS AND PRE-SET BANDS | OTHER BANDS | ANNOTATIONS |
|
| | | |
 |
 |
Upon starting the command a new layout tab is created named Section Preview, and a preview of the output cross section sheets is displayed in that layout. The sections in that layout are updated as the cross section plot output is edited. Each sheet can subsequently be output to individual layouts, or each sheet can be output to individual files.
General Process
- On starting the cross section plot command the Designer is requested to "Select Alignment or Press Enter to Select from a List:". So either select a Road Object in the drawing or if you press [Enter] a list box is displayed for selection of a String to plot. Select a string and click OK, or Cancel to exit. A Selection panel enables filtering of the list to particular types of Strings.
- Following selection of a String the user will be prompted to select the sections to include in the cross section plot. Options include using the Selected Sections list or all Sections. Users can edit the Selected Sections list and will see a form and interface matching the Select Sections to Plot command.
- Following this, the Cross Section Plotting form will display. Details are below.
Dynamics During Editing
When the Cross Section Plot window is displayed, any edits made to the vertical grading of the string, or other edits that trigger a rebuild of the model, will result in an immediate update of the cross sections presented in the Section Preview layout tab.
Navigation
Right Click functionality has be added to provide access to a number of tools. Double clicking has also been added to provide quick access item edits.
| Right Click Selection | ||||||||||
|
||||||||||
|
Details
Cross Section Plotting - General
The cross section plotting provides a great deal of flexibility in displaying cross section data. The cross section plotting process can create a series of Layout tabs within the current drawing. Alternatively the process can create a series of separate drawing files which can be plotted or used as a external reference file (XREF).
Using the Plot Controls
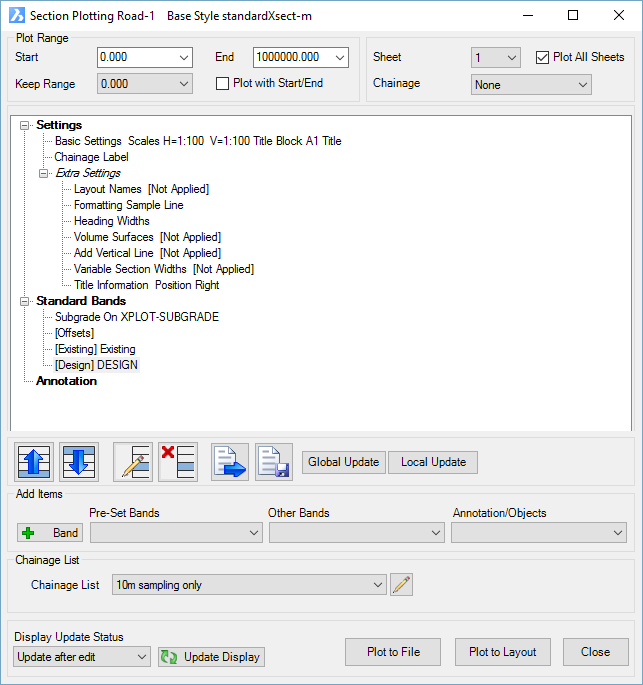
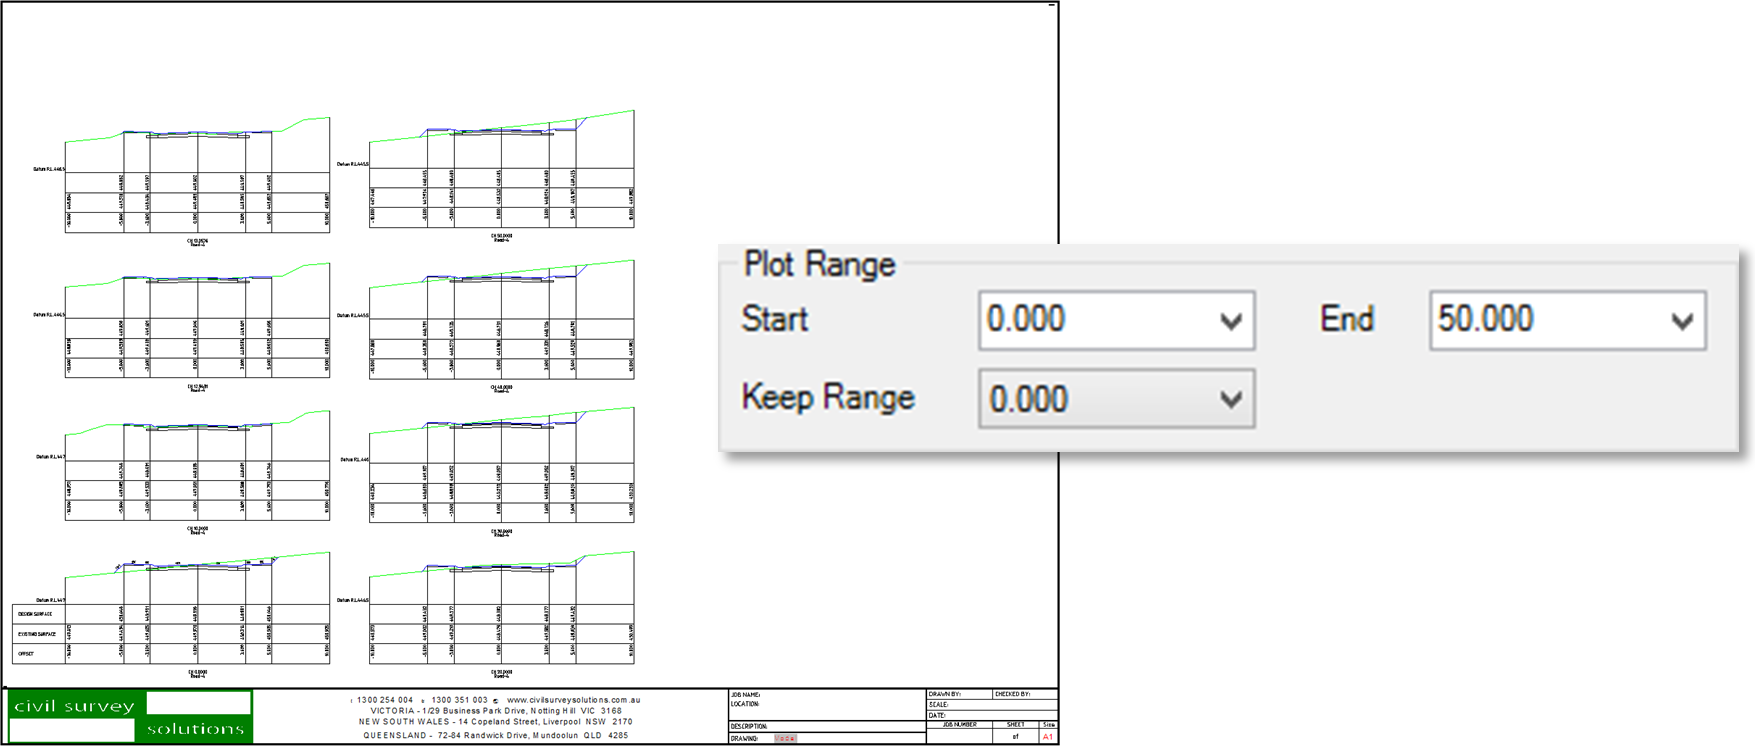
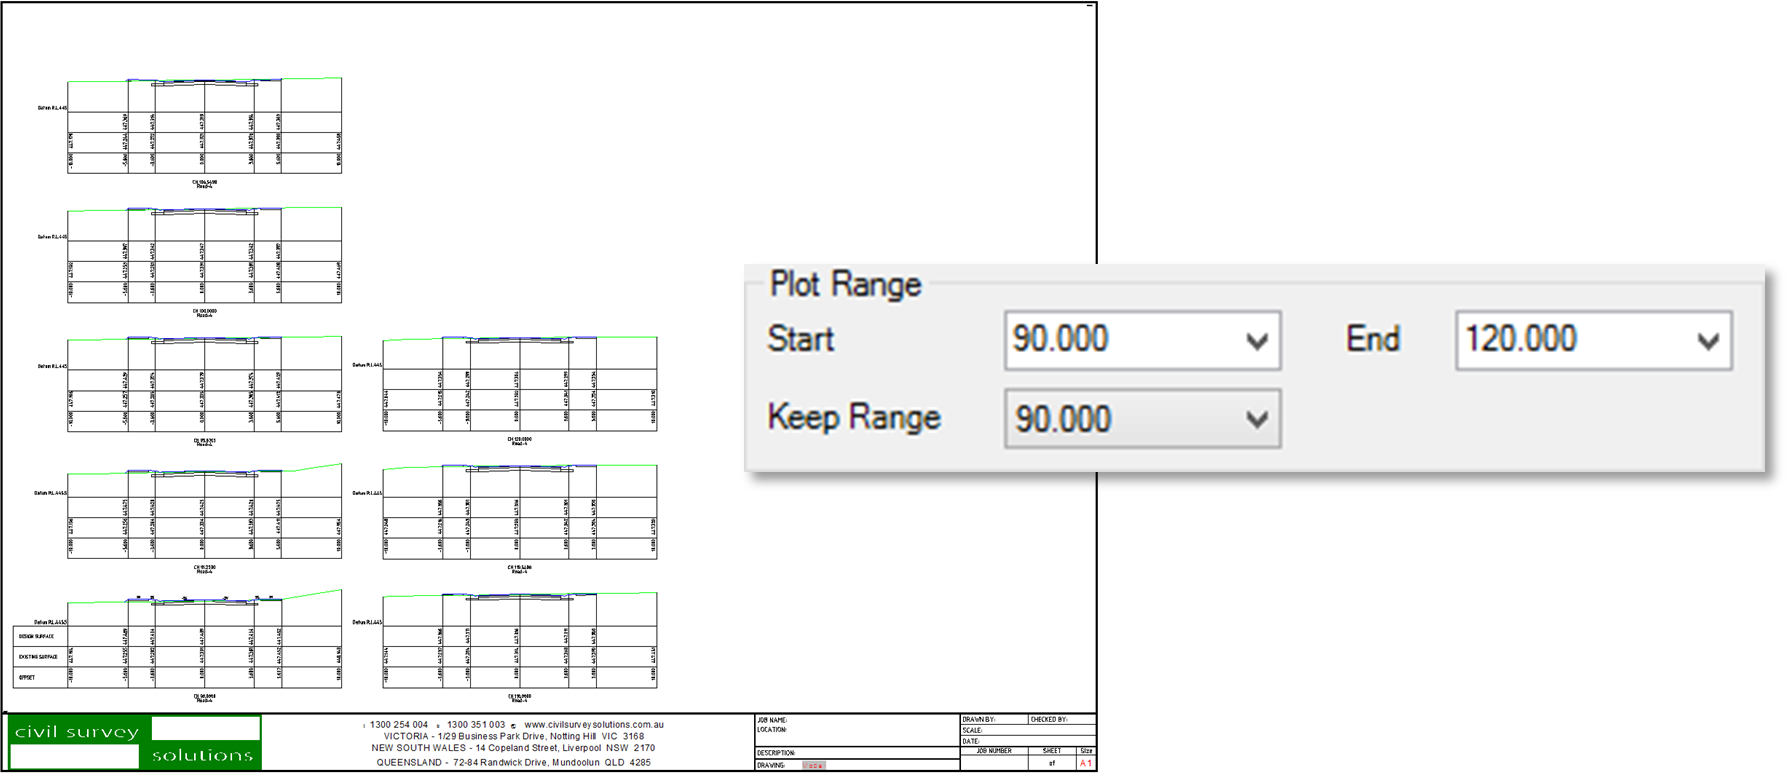
| Plot Range Controls | ||
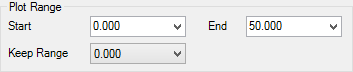 |
Start | Pick the start chainage to plot |
| End | Pick the end chainage to plot | |
| Keep Range | Keep the range of chainages between the start and end chainage | |
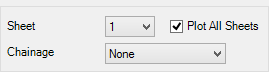 |
Sheet | Pick which sheet to view |
| Chainage | Select which chainage to view in the preview | |
| Plot All Sheets | Pick tickbox to plot all sheets otherwise the form will plot selected sheet | |
| Load/Save Plot Style | This allows the user to save the current plotting setup as style that can be later loaded for use on other jobs. | |
| Save a copy (style set) of the current output settings. Note: All plot style settings are saved in the 'common' folder where configuration files are stored - click here for more information regarding storage of configuration files. | ||
| Load a saved plot style set from the Save Style command. | ||
| Global/Local Update | ||
| Changes made to this form will set the defaults for all new projects only | ||
| Changes made to this form will set the defaults for the current project only | ||
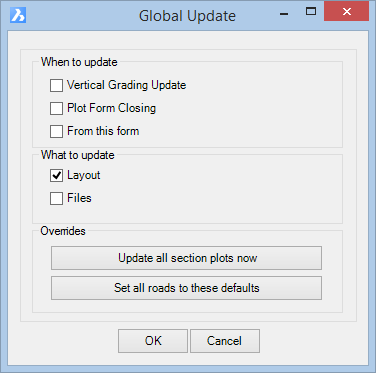 |
When to Update | |
| Vertical Grading Update | Any changes made in the Vertical Grading Editor (VGE) will automatically update the plotted cross section layouts / files | |
| Plot Form Closing | Any changes made in the Cross Section plot form will automatically update the plotted cross sectionsn layouts / files | |
| From this form | Any changes made in the Global/Local update form will automatically update the plotted cross sections layouts / files | |
| What to Update | ||
| Layout | Changes that are made to the above forms will automatically update the plotted cross section layouts | |
| Files | Changes that are made to the above forms will automatically update the plotted cross section files | |
| Overrides | ||
| Select to update all plotted cross section layouts / files in the current drawing | ||
| Select to set all roads to use the defaults in this form | ||
| Click ok to confirm changes made in the form | ||
| Click cancel to dismiss changes made in the form | ||
| Chainage List | Apply a named list to manage the section views that are displayed. | |
| Chainage List |
Use the pick list to select a Chainage list - if a list is selected, the sections that are presented will be controlled by the named list instead of the Selected Sections. The form is shown, below: 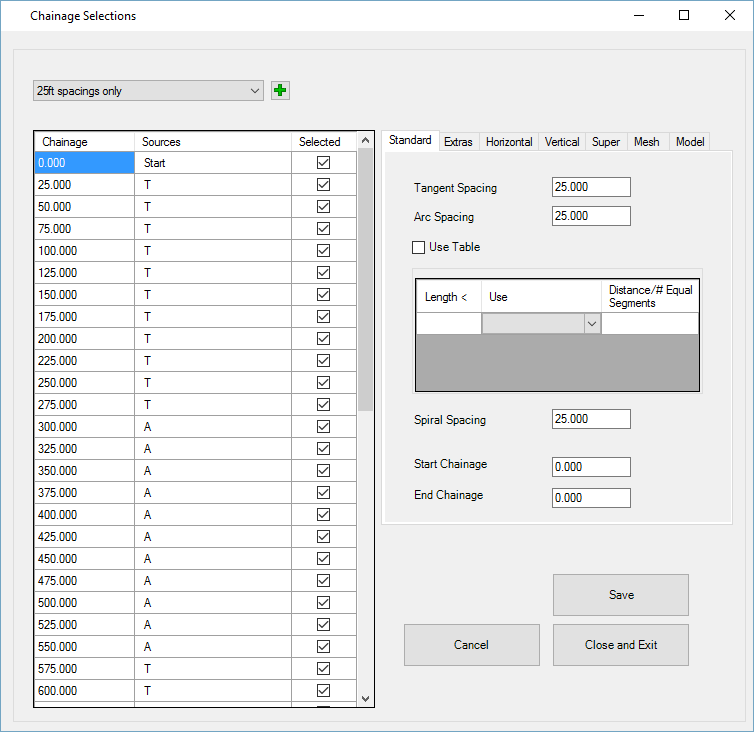 For information on creating and editing Chainage lists, see the Section Manager command. |
|
| Edit List | Select the icon to edit the selected Chainage list. | |
| Display Update Status | ||
 |
Any updates made to the cross section plotting form will not update the preview state of the cross sections. Selecting Update Display will update the preview. | |
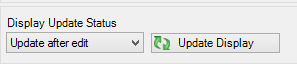 |
Any updates made to the cross section plotting form will automatically update the preview state of the cross sections. | |
| Plotting Options | ||
| This button will output the plot sheets into separate Layout tabs within the current drawing. | ||
| This button will output the plot sheets as separate drawing files. By default, files will be generated in the same directory as the drawing file in the folder /'[drawing file name]-Data'/AdvRoads-10/Xsects unless set to a different location in the Layout Format settings form. |
||
| Exit this command without Plotting. | ||
 Help Help |
Open the Help file and display this information. | |
SETTINGS, BAND AND ANNOTATION CONTROLS
Data has been grouped into settings, band and annotation controls. All options are listed below in the relevant groups. Use the Hyperlinks below to jump to the relevant group of interest.
SETTINGS | ADD BANDS AND PRE SET BANDS | OTHER BANDS | ANNOTATIONS
Settings
Basic Settings
Scales and Layout
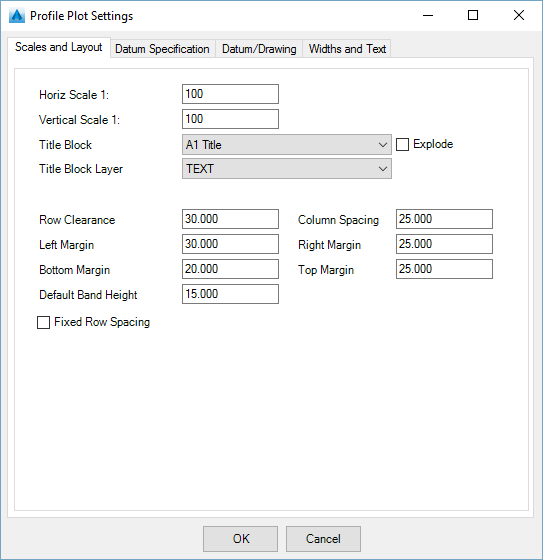
Horiz Scale 1: Input the horizontal scale of the cross sections Vertical Scale 1: Input the vertical scale of the cross sections Title Block Select title block to use. Title Blocks should be stored in the following folder: C:\ProgramData\CSS\ARD\Common\common-10 Click here to view help on Title Blocks Explode Tick on to explode the block upon insert. Title Block Layer Select the layer for the Title Block Row Clearance This is the height between each cross sections row. The value is in plotted millimetres/inches.
Fixed Row Spacing unticked. Fixed Row Spacing ticked. Left Margin Set the offset from the left edge of the plotting area to the start of the plotting.BAND HEADINGS ARE IGNORED. The value is in plotted millimetres/inches. Right Margin Set the minimum offset from the right edge of the plotting area to the end of the plotting. If this distance is exceeded the program will start additional tabs/drawings as required. The value is in plotted millimetres/inches. Bottom Margin Set the offset from the bottom edge of the plotting area to the start of the plotting. The value is in plotted millimetres/inches. Top Margin Set the minimum offset from the top edge of the plotting area to the start of the plotting. The value is in plotted millimetres/inches. Default Band Height Specify the default band height. Fixed Row Spacing When unticked, row spacing is measured from the highest section elevation on one section to the bottom of the bands of the next section
When ticked, row spacing is measured from the top of the bands on one section to the bottom of the bands of the next section.Datum and Specification
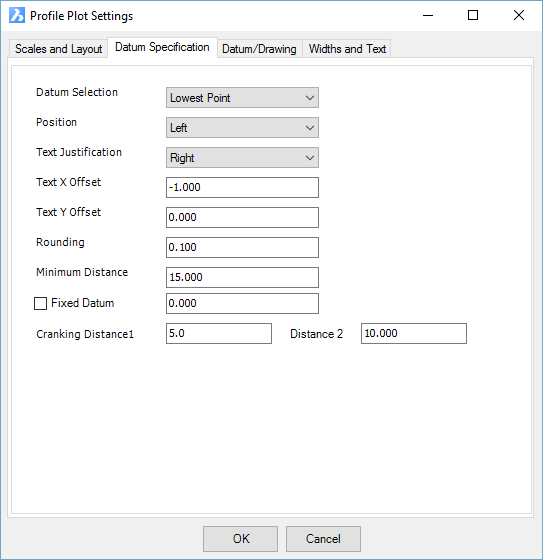
Datum Selection
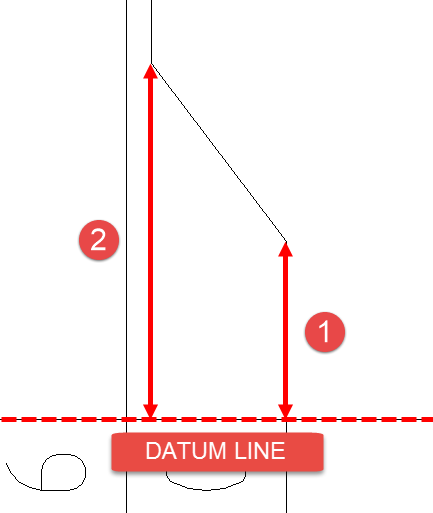
Lowest Point NS C.L. Design C.L. Position Select overall insertion position for the datum text Text Justification Select Left/Right for text justification Text X Offset Type in an x offset for the text Text Y Offset Type in a y offset for the text Rounding Decimal place of the datum value Minimum Distance Minimum distance between datum and the lowest level Fixed Datum Pick tickbox to confirm a fixed datum for all cross sections Cranking Distance 1 Changes the value of the high crank. Value must need exceed the minimum distance. Cranking Distance 2 Changes the value of the low crank. Value must be less than Cranking Distance 1. Datum/Drawing
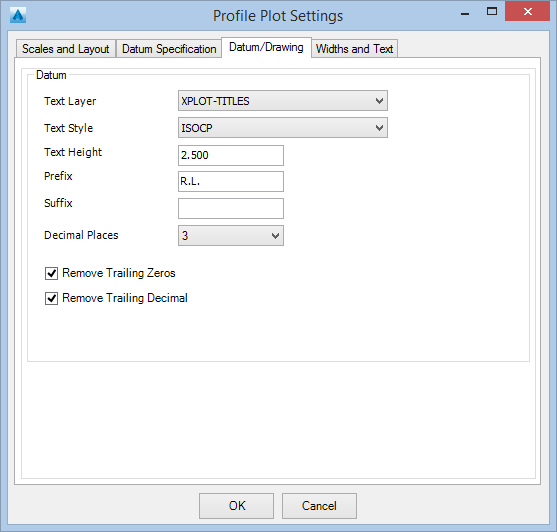
Text Layer From the drop list provided, select the Text layer to be used. Text Style From the drop list provided, select the Text style to be used. Text Height Enter the Height (in mm) for the text size. Prefix Enter a prefix for the text in the data band. Suffix Enter a suffix for the text in the data band. Decimal Places From the drop list provided, select the number of decimals for the text. Remove Trailing Zeros Select tickbox to remove plotting trailing zeroes. ie. RL 447.000 = RL 447 Remove Trailing Decimal Select tickbox to remove plotting trailing decimals. ie. RL 447. = RL 447 Widths & Text
The functional buttons available from all Tabs are described below:
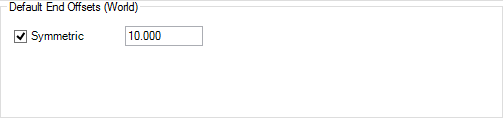
Symmetric Ticking the box will allow the user to have the same distance of section either side of zero:
Left Text This distance is the extend of the displayed text on the section to the left of zero Right Text This distance is the extend of the displayed text on the section to the right of zero Left Lines This distance is the extend of the displayed linework on the section to the left of zero Right Lines This distance is the extend of the displayed linework on the section to the right of zero. Linework and Text Settings Basic Linework Layer Select the layer for the linework Offset for Start/End of Text from a Line (D) Enter a value to define where the band text is positioned vertically from the top band line (Default is 1) Offset for Top/Bottom of Text Above/Below Line (D) Enter a value to define where the band text is positioned horizontally from the offset line (Default is 1) Basic Linework Layer Setting these values will automatically populate the bands that are added to the cross sections Heading Layer Enter a value to define the default Heading text layer Heading Text Style Enter a value to define the default Heading text style Heading Text Height Enter a value to define the default Heading text height Text Layer Enter a value to define the default Band text layer Text Style Enter a value to define the default Band text style Text Height / Decimals Enter a value to define the default Band text height & default decimal places Line Layer Enter a value to define the default Linework layer

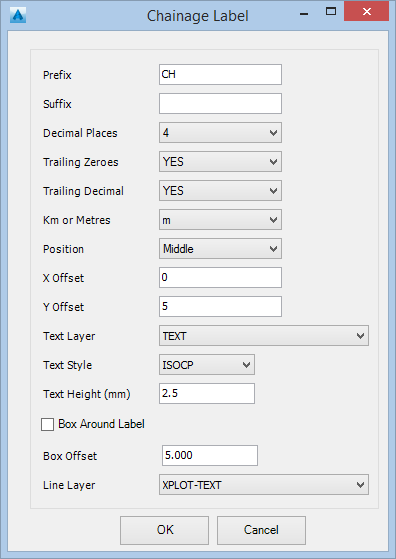
Chainage Label Prefix Enter a Prefix for the text in the data band. Suffix Enter a Suffix for the text in the data band. Decimal Places From the drop list provided, select the number of decimals for the text. Trailing Zeroes Select tickbox to remove plotting trailing zeroes. ie. CH 150.000 = CH 150 Trailing Decimal Select tickbox to remove plotting trailing decimals. ie. CH 150. = CH 150 Km or Metres A tick box is provided. Recommended to tick ON for a Model and OFF for a surface (unless it is desired to show all grade breaks of the surface in the bands/rows). Position From the drop list provided, select the text position under the section X Offset Enter a X Offset (in mm) for the text from the Position Y Offset Enter a Y Offset (in mm) for the text from the Position Text Layer From the drop list provided, select the Text layer to be used. Text Style From the drop list provided, select the Text style to be used. Text Height Enter the Height (in mm) for the text size. Box Around Label Select tickbox to add a box border around the text Box Offset Enter the Height (in mm) for the text size. Line Layer From the drop list provided, select the Box linework layer to be used.
Extra Settings
Layout Naming
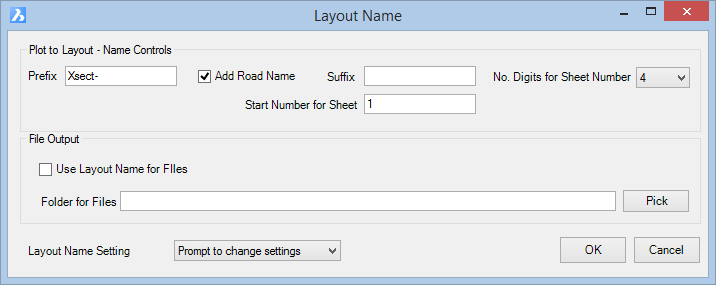
This form controls how the layout tabs are named during plottingPlot to Layout - Name Controls Prefix Enter a Prefix for the text in the layout. Add Road Name Select tickbox to include the road name in the layout name Suffix Enter a Suffix for the text in the layout. Start Number for Sheet Enter a number to define the start sheet number for the plots No. Digits for Sheet Number From the drop list provided, select the number of digits for the layout number Layout Name Setting
Use Settings Select this option to always use the settings in the form when plotting Prompt to change settings Select this option to always be prompted with this form when plotting File Output Use Layout Name for Files Select tickbox to use the layout naming for the file name Folder for Files Select Pick to choose where the Plot to File is saved. If left empty / default is the drawing -data folder.
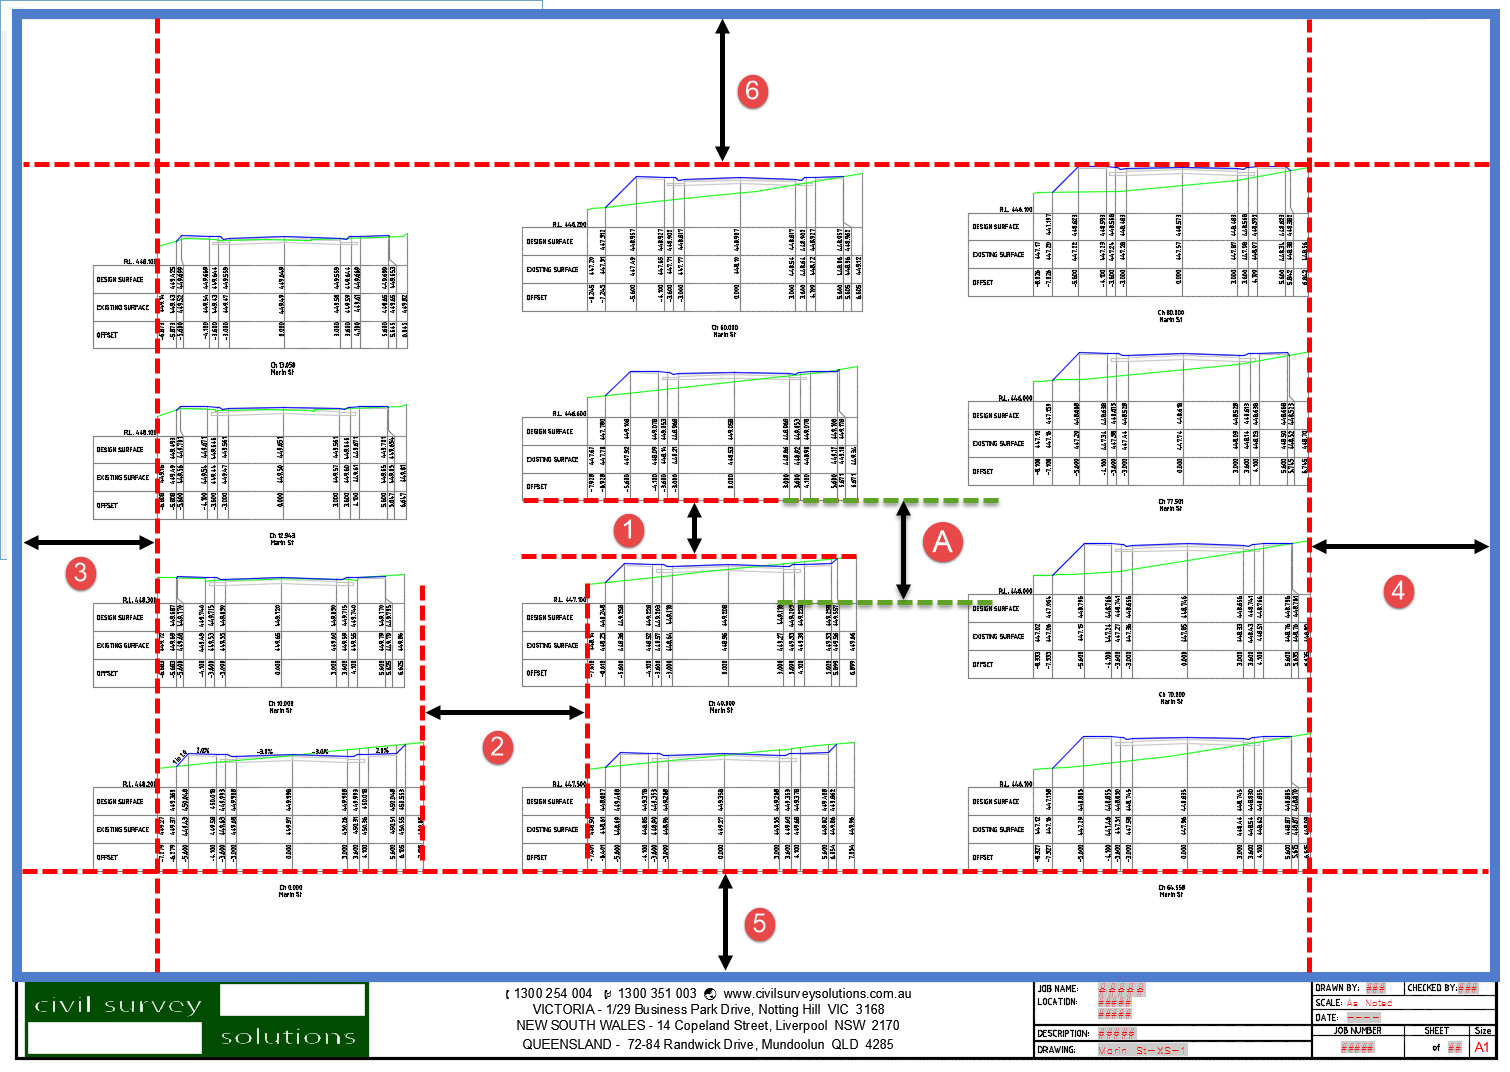
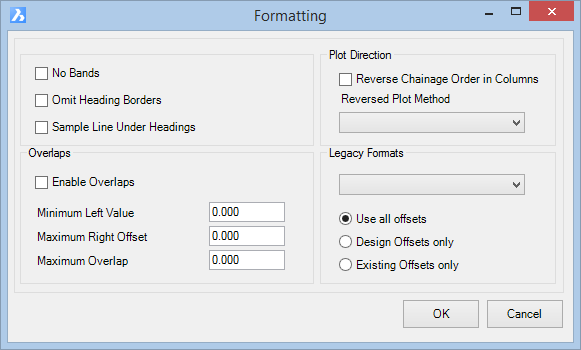
Formatting No Bands Select tickbox to remove bands from the cross sections Omit Heading Borders Select tickbox to remove the heading borders Sample Line Under Headings Select tickbox to include a sample line underneath the headings text Overlaps Enable Overlaps Select tickbox to enable overlaps Minimum Left Value Enter a value (mm) for the left offset Maximum Right Offset Enter a value (mm) for the right offset Maximum Overlap Enter a value (mm) for the maximum offset Plot Direction Reverse Chainage Order in Columns Select tickbox to reverse the order of sections on the sheet Reversed Plot Method
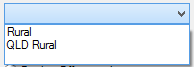
Align Bottom Base All sections are aligned at the bottom of the sheet using the bases on the sections Top Row - Highest Points Align All sections are aligned at the top of the sheet using the highest points on the sections Top Row - Bases Align All sections are aligned at the top of the sheet using the bases on the sections Legacy Formats From the drop list provided, select the legacy plotting styles. Rural & QLD Rural.
Both of these apply default formatting which includes removal of all bands from the section display.
When applied, the Design and Existing band items in the list of items control the display of the text for design and existing elevations.Use all offsets Select this option to use all offsets Design Offsets only Select this option to use all design offsets Existing Offsets only Select this option to use all existing offsets
Headings Label
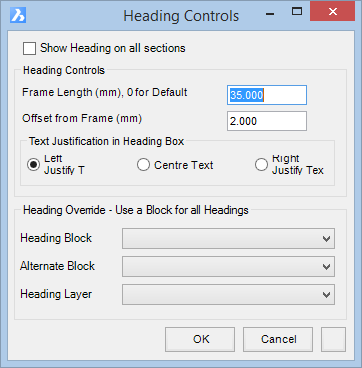
Controls the heading text & linework for all the bandsShow Headings on all Sections Select tickbox to enable headings on all sections Heading Controls Frame Length (mm), 0 for Default Enter a value (mm) to specify the heading box width Offset from Frame (mm) Enter a value (mm) for the text to be offset from the box Text Justification in Heading Box
Left Justify Text Select to justify text to the left side of the heading box Centre Text Select to justify text to the centre of the heading box Right Justify Text Select to justify text to the right side of the heading box Heading Override Enter a value (mm) for the maximum offset Enable Overlaps Select to justify the band heading text from the centre of the box. Minimum Left Value Select to justify the band heading text from the right of the box. Maximum Right Offset Enter length (in mm) of the headings box. Default is 0.
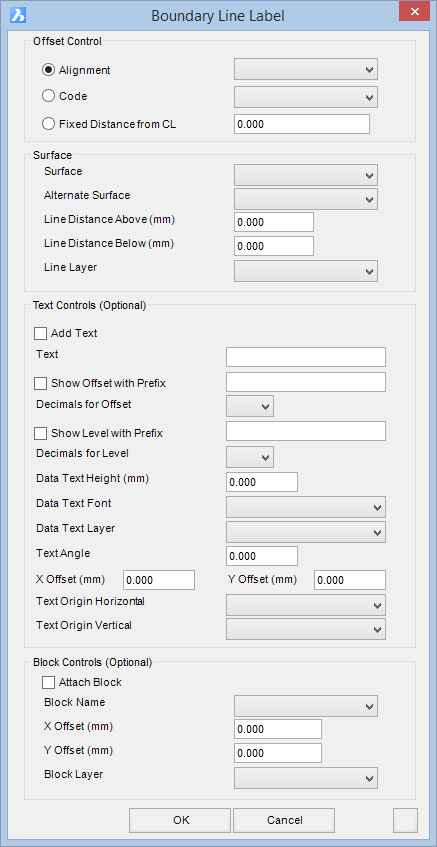
Vertical Line 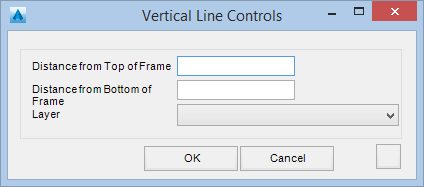
This control draws a vertical line at the alignment control line.
Distance from Top of Frame Enter the distance to stop the line from the top of the Frame, in millimetres/inches. Distance from Bottom of Frame Enter the distance to start the line from the bottom of the Frame, in millimetres/inches. Layer Select the layer for the line to be drawn on, from the drop list provided.
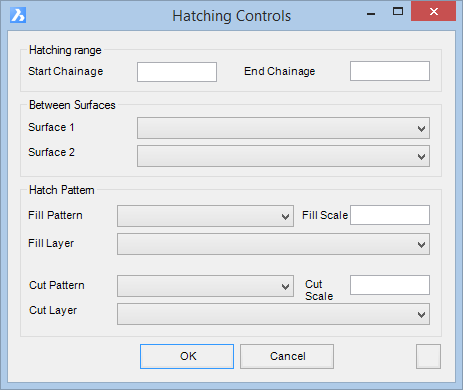
Volume Surfaces 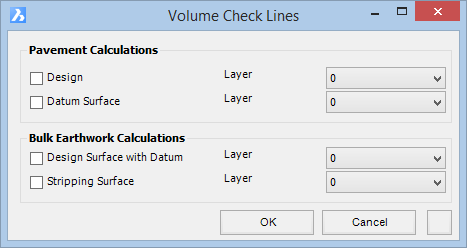
This control is used to display Check lines for volume calculations, either to the Design or Datum surface for Pavement and either Design with Datum and Stripping for Bulk Earthworks. These lines can then be used to check the areas at each section and perform a manual check on volume calculations.
Pavement Calculations This will draw lines to the limits of the pavement extents to check pavement volumes. Design A tick box is provided. Placing a tick means the item is active and will be plotted. Leaving the box empty, means that this will not be plotted. Layer Select the layer for the line to be drawn on, from the drop list provided. Datum Surface A tick box is provided. Placing a tick means the item is active and will be plotted. Leaving the box empty, means that this will not be plotted. Layer Select the layer for the line to be drawn on, from the drop list provided. Bulk Earthworks Calculations This will draw lines to the earthworks limits and can include the stripped surface to check earthworks volumes. Design Surface with Datum A tick box is provided. Placing a tick means the item is active and will be plotted. Leaving the box empty, means that this will not be plotted. Layer Select the layer for the line to be drawn on, from the drop list provided. Stripping Surface A tick box is provided. Placing a tick means the item is active and will be plotted. Leaving the box empty, means that this will not be plotted. Layer Select the layer for the line to be drawn on, from the drop list provided.
Section Widths 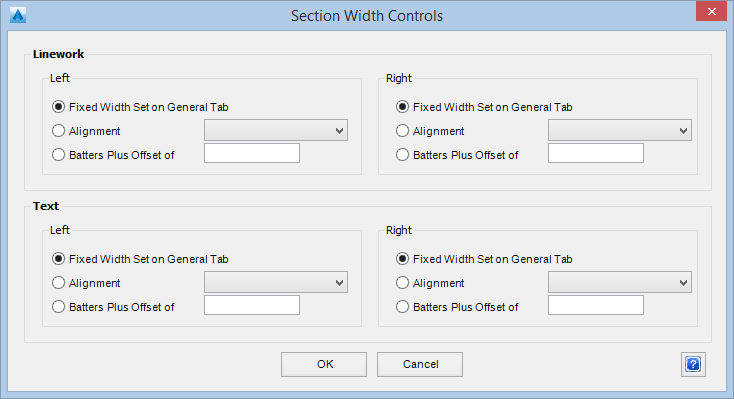
This control allows the width of the plotted cross section to vary depending of the variable selected, for both linework and text, independent of what is set on the General Tab.
Linework Options are provided so that the Left and Right sides can be controlled independently. Fixed Width Set on General Tab Select this Toggle and the width will be set to match that on the General Tab. Alignment Select this Toggle and then an Alignment from the drop down list provided to control the width of the section. Note: The required alignments need to exist. Batters Plus Offset of Select this Toggle and then enter a distance (in metres) in the box provided to add to the batter intersection point offset. Text Options are provided so that the Left and Right sides can be controlled independently. Fixed Width Set on General Tab Select this Toggle and the width will be set to match that on the General Tab. Alignment Select this Toggle and then an Alignment from the drop down list provided to control the width of the section. Note: The required alignments need to exist. Batters Plus Offset of Select this Toggle and then enter a distance (in metres) in the box provided to add to the batter intersection point offset.
Title Information 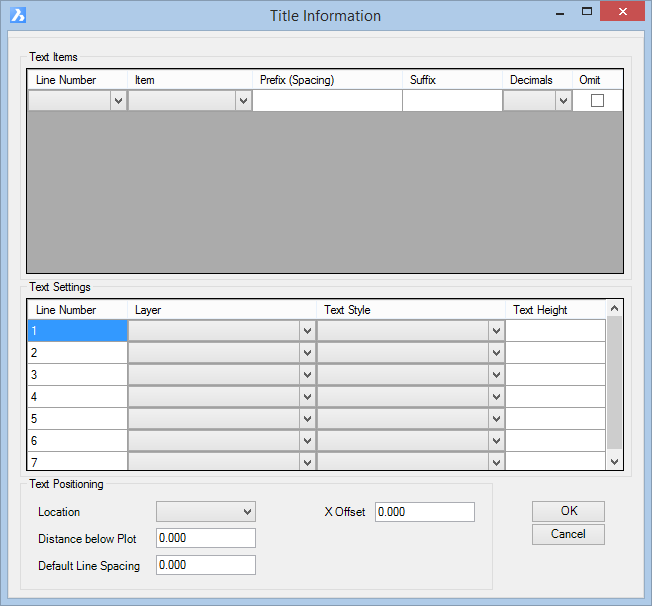
This command opens the above form where the Designer can add Title Information.
Text Items Line Number Choose the line number to assign the text content Item Choose which item to display on the line:
- Heading
- Spacing
- Horizontal Scale
- Vertical Scale
- Road NamePrefix (Spacing) Input a prefix for the start of the text content Suffix Input a prefix for the end of the text content Decimals Select the decimals be place with any numeric values Omit Tick this box to omit the line from the overall title information Text Settings Line Number Preset value representing each line of the title (not editable) Layer Select a layer for the text on the line Text Style Select a style for the text on the line Text Height Input a text height Text Positioning Location Choose which item to position the title information under the cross section
- Left
- Right
- CentreDistance below Plot Enter a value to define how far the Line 1 will be positioned underneath the cross section Default Line Spacing Enter a value to define the spacing between each title line X Offset Enter a value to move the title text on the X axis underneath the cross section
BAND AND ANNOTATION CONTROLS
Select the band and annotation controls of interest to jump to that location.
ADD BANDS AND PRE SET BANDS | OTHER BANDS | ANNOTATIONS
Add Bands and Pre-Set Bands
The Add Band command button allows users to create a band by firstly selecting the Data Source to use in the band: this could be the design string elevations, design codes, existing surface elevations, height difference, offset or other source. Following this, users establish the heading controls, band text details, offset controls and any labelling (as relevant) on the sections.
This is a fully confgurable band.
The Pre Set Bands automate the assignment of a Data Source by selecting a particular type of band - additionally some other items may be disabled in the form as they are not applicable to that band.
For this help, we will be covering the Add Band command and explaining configuration required for certain Source Data selected in the band.
Add Band
 OVERALL CONTROLS |
|||||||||||||||||||||||||||||||||||||||||||||||||||||||||||||||||||||||||||||||||||
| Control Tabs | The tabs along the top of the form provide user control over the data being applied and how it is displayed | ||||||||||||||||||||||||||||||||||||||||||||||||||||||||||||||||||||||||||||||||||
| Apply | Whenever the form is edited, the Apply button can be used to update the Section Sheet display without closing the form | ||||||||||||||||||||||||||||||||||||||||||||||||||||||||||||||||||||||||||||||||||
| OK | Save and apply changes | ||||||||||||||||||||||||||||||||||||||||||||||||||||||||||||||||||||||||||||||||||
| Cancel | Cancel |
||||||||||||||||||||||||||||||||||||||||||||||||||||||||||||||||||||||||||||||||||
| BASIC SETTINGS TAB | |||||||||||||||||||||||||||||||||||||||||||||||||||||||||||||||||||||||||||||||||||
 |
|||||||||||||||||||||||||||||||||||||||||||||||||||||||||||||||||||||||||||||||||||
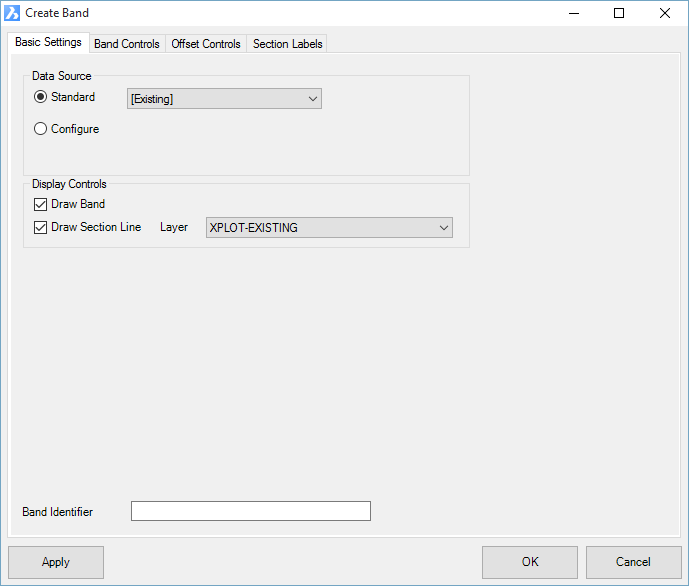
| Data Source | Select what data to use in the bands and presented (where applicable) as section lines. Some bands require configuration. | ||||||||||||||||||||||||||||||||||||||||||||||||||||||||||||||||||||||||||||||||||
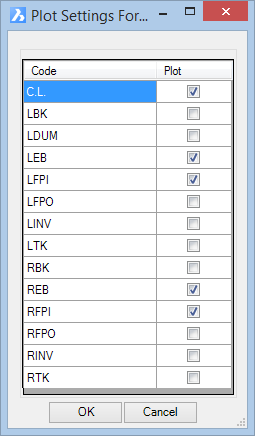
| Standard | Standard bands typically do not need to be configured. Any items in square brackets, [ ], represent data created or managed by the software. Other items in the list allow inclusion of named surfaces. Options are as listed below:
|
||||||||||||||||||||||||||||||||||||||||||||||||||||||||||||||||||||||||||||||||||
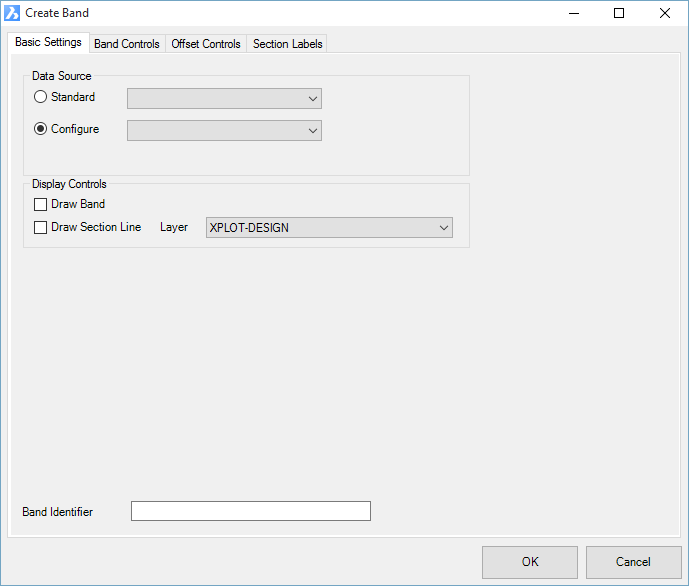
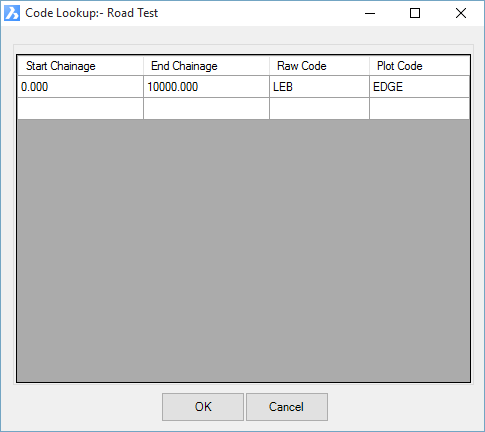
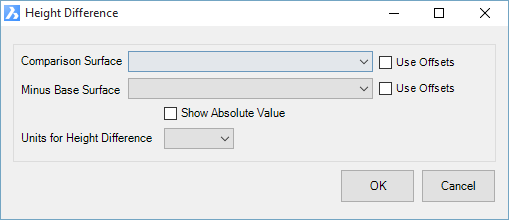
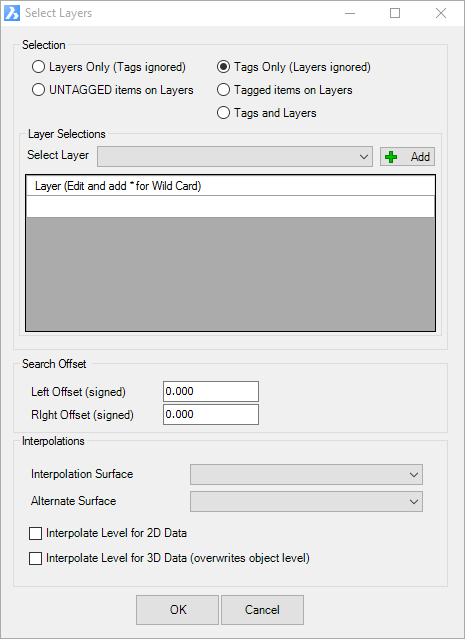
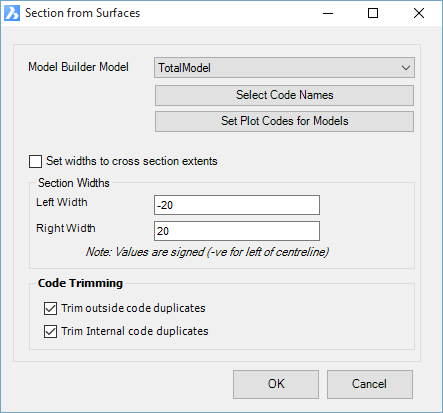
| Configure | Configure bands typically require the user to configure how the data is to be applied. Band options are as listed below
|
||||||||||||||||||||||||||||||||||||||||||||||||||||||||||||||||||||||||||||||||||
| Display Controls | Select what data to use in the bands and presented (where applicable) as section lines. Some bands require configuration. | ||||||||||||||||||||||||||||||||||||||||||||||||||||||||||||||||||||||||||||||||||
| Draw Band | Tick on to draw a band (row) below or above the cross section draw window. A Band consists of a heading (optional) and offset locations where information (such as elevation, offset, code) are reported. If ticked on, the Band can be configured by the Band Controls tab and Offset Controls tab. | ||||||||||||||||||||||||||||||||||||||||||||||||||||||||||||||||||||||||||||||||||
| Draw Section Line | Where a Type is selected that can be drawn (such as a surface, or design sections), this tick box will draw the section lines on the output cross sections. | ||||||||||||||||||||||||||||||||||||||||||||||||||||||||||||||||||||||||||||||||||
| Layer | Select a layer to draw the section lines on | ||||||||||||||||||||||||||||||||||||||||||||||||||||||||||||||||||||||||||||||||||
| Draw Section Labels | Tick on to draw objects on the plotted sections, including text information and crossfall annotation. If ticked on, the Section Labels can be controlled by the Section Labels tab. | ||||||||||||||||||||||||||||||||||||||||||||||||||||||||||||||||||||||||||||||||||
| Band Identifier | The information stored in a band (such as offset or elevation) can be merged (added) into another band. The Band Identifier is used to select a band to merge into. |
||||||||||||||||||||||||||||||||||||||||||||||||||||||||||||||||||||||||||||||||||
| BAND CONTROLS TAB | |||||||||||||||||||||||||||||||||||||||||||||||||||||||||||||||||||||||||||||||||||
 |
|||||||||||||||||||||||||||||||||||||||||||||||||||||||||||||||||||||||||||||||||||
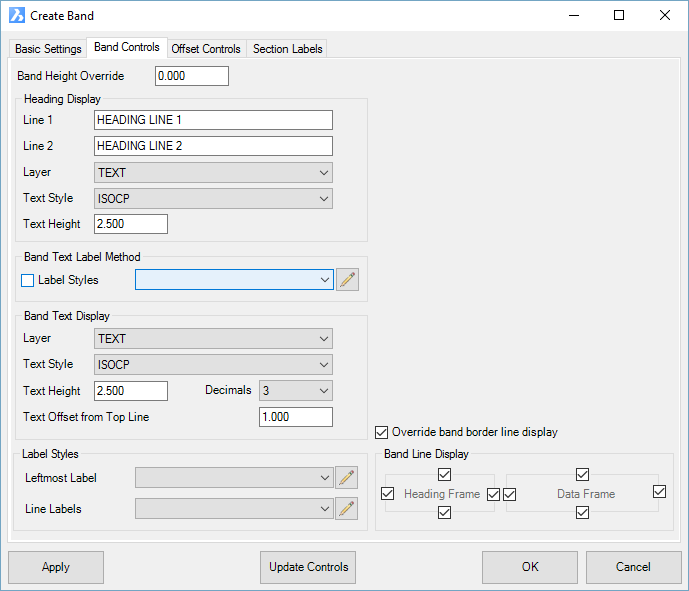
| Row Height Override | Enter a value to override the default band height (default height specified in the Basic Settings form) | ||||||||||||||||||||||||||||||||||||||||||||||||||||||||||||||||||||||||||||||||||
| Heading Display | Set the heading display controls | ||||||||||||||||||||||||||||||||||||||||||||||||||||||||||||||||||||||||||||||||||
| Line 1 | Enter the Heading for the particular Data Band being entered. | ||||||||||||||||||||||||||||||||||||||||||||||||||||||||||||||||||||||||||||||||||
| Line 2 | Enter the Heading for the particular Data Band being entered. | ||||||||||||||||||||||||||||||||||||||||||||||||||||||||||||||||||||||||||||||||||
| Layer | From the drop list provided, select the Text layer to be used. | ||||||||||||||||||||||||||||||||||||||||||||||||||||||||||||||||||||||||||||||||||
| Text Style | From the drop list provided, select the Text style to be used. | ||||||||||||||||||||||||||||||||||||||||||||||||||||||||||||||||||||||||||||||||||
| Text Height | Enter the Height for the text size. | ||||||||||||||||||||||||||||||||||||||||||||||||||||||||||||||||||||||||||||||||||
| Band Text Label Method | The band text can be represented as simple text, or managed by a Label Style for more control | ||||||||||||||||||||||||||||||||||||||||||||||||||||||||||||||||||||||||||||||||||
| Apply Label Style | From the drop list provided, select a Label Style to use within the data band. Note: The label style controls differ in the following respects when applied to a Band: Text Components - additional controls for the text Insert Position - text can be inserted relative to the Top of the Band, Middle of the Band or Bottom of the Band Line Components - additional controls per entry for start position - pick From Top to be relative to top of band or From Bottom to be relative to the bottom of band |
||||||||||||||||||||||||||||||||||||||||||||||||||||||||||||||||||||||||||||||||||
| |
Pick to edit the selected Label Style | ||||||||||||||||||||||||||||||||||||||||||||||||||||||||||||||||||||||||||||||||||
| Band Text Display | If Apply Label Style is unticked, these text settings apply. Text is always rotated 90 degrees to be parallel with the vertical offset line that defines the offset location. | ||||||||||||||||||||||||||||||||||||||||||||||||||||||||||||||||||||||||||||||||||
| Layer | From the drop list provided, select the Text layer to be used. | ||||||||||||||||||||||||||||||||||||||||||||||||||||||||||||||||||||||||||||||||||
| Style | From the drop list provided, select the Text style to be used. | ||||||||||||||||||||||||||||||||||||||||||||||||||||||||||||||||||||||||||||||||||
| Text Height | Enter the Height (in mm) for the text size. | ||||||||||||||||||||||||||||||||||||||||||||||||||||||||||||||||||||||||||||||||||
| Decimals | From the drop list provided, select the number of decimals for the text. | ||||||||||||||||||||||||||||||||||||||||||||||||||||||||||||||||||||||||||||||||||
| Text Offset from Top Line | Sets the distance of the text from the top of the band. | ||||||||||||||||||||||||||||||||||||||||||||||||||||||||||||||||||||||||||||||||||
| Label Styles | If Apply Label Style is ticked, these Label Styles apply. | ||||||||||||||||||||||||||||||||||||||||||||||||||||||||||||||||||||||||||||||||||
| Leftmost Label | This is an override - set a different Label Style to apply to the leftmost label (first offset on left) on each section | ||||||||||||||||||||||||||||||||||||||||||||||||||||||||||||||||||||||||||||||||||
| Line Labels | This is an override - set a different Label Style to apply to offsets that are reported but do not originate from the data source. Note: Offsets can created by the data source, or else be reported for a different data source (a different band). If the offsets did not come from this data source, it may be desired to display it differently (eg: just a line and no text). |
||||||||||||||||||||||||||||||||||||||||||||||||||||||||||||||||||||||||||||||||||
| Override band border line display | Tick on to override the display of the band borders for the heading and data. | ||||||||||||||||||||||||||||||||||||||||||||||||||||||||||||||||||||||||||||||||||
| Band Line Display | Tick boxes for the top, bottom, left and right lines of the heading and data frame can be toggled on/off |
||||||||||||||||||||||||||||||||||||||||||||||||||||||||||||||||||||||||||||||||||
| OFFSET CONTROLS TAB | |||||||||||||||||||||||||||||||||||||||||||||||||||||||||||||||||||||||||||||||||||
 |
|||||||||||||||||||||||||||||||||||||||||||||||||||||||||||||||||||||||||||||||||||
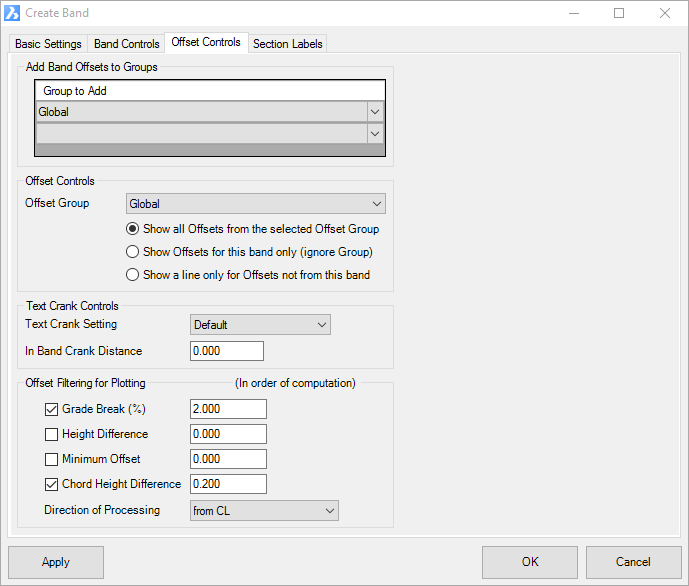
| Add Band Offsets to Group | Most Band sources contribute offsets to the band (eg: grade breaks on a surface). These are placed in a Band Group so the offsets can also be reported and used in another band. This delivers consistent offset sampling through all bands. The default band is called Global - this is normally used consistently to add offsets from each band to all other bands. If no Group is selected, then the offsets generated by this band will not be shown in any other band. |
||||||||||||||||||||||||||||||||||||||||||||||||||||||||||||||||||||||||||||||||||
| Group to Add | Select all the Group/s that the offsets of this band contribute to. Recommended default is Global. | ||||||||||||||||||||||||||||||||||||||||||||||||||||||||||||||||||||||||||||||||||
| Offset Controls | This sets what Offsets are shown in the band. Users can elect to show only the offsets created by the band, or the offsets of a Group. | ||||||||||||||||||||||||||||||||||||||||||||||||||||||||||||||||||||||||||||||||||
| Offset Group | Select the Group to use for the band offsets. | ||||||||||||||||||||||||||||||||||||||||||||||||||||||||||||||||||||||||||||||||||
| Show all offsets from the selected Offset Group | 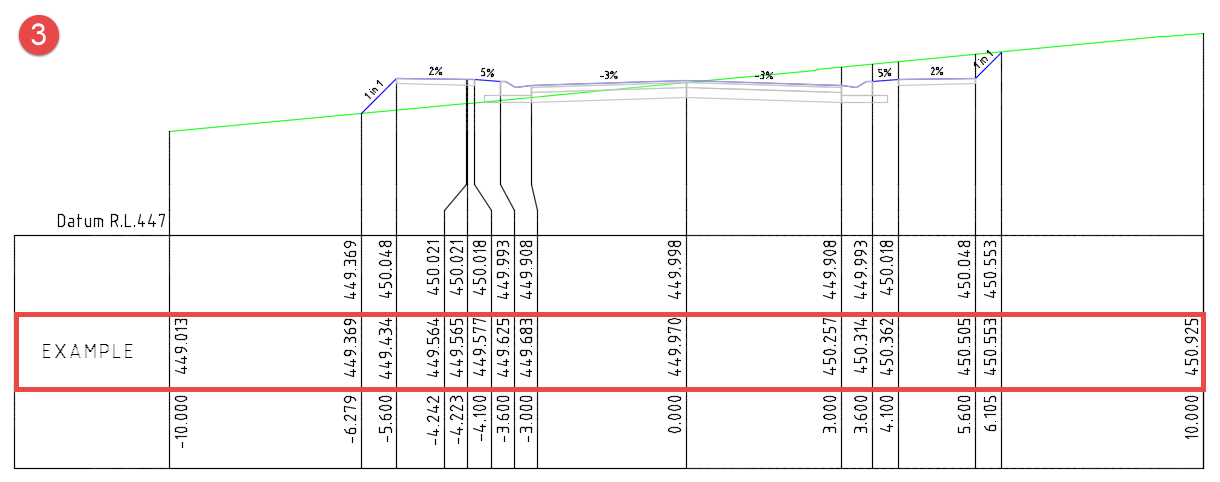 All offsets from the Group including all text information. This is the default condition |
||||||||||||||||||||||||||||||||||||||||||||||||||||||||||||||||||||||||||||||||||
| Show offsets for this band only (ignore Group) | 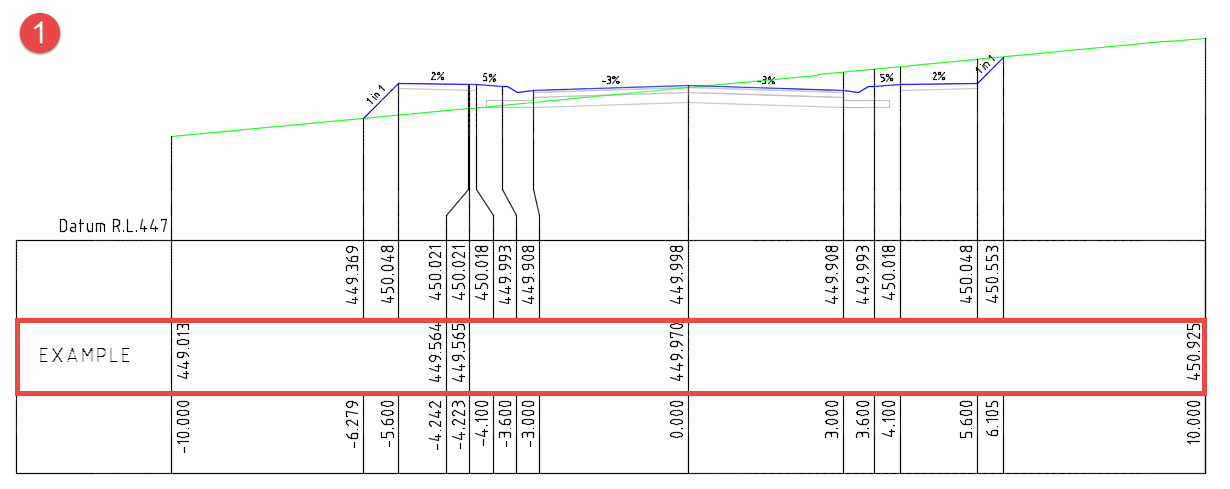 Only the offsets created by this Band are shown - any offsets from any other Band are not shown. |
||||||||||||||||||||||||||||||||||||||||||||||||||||||||||||||||||||||||||||||||||
| Show a line only for Offsets not from this band | 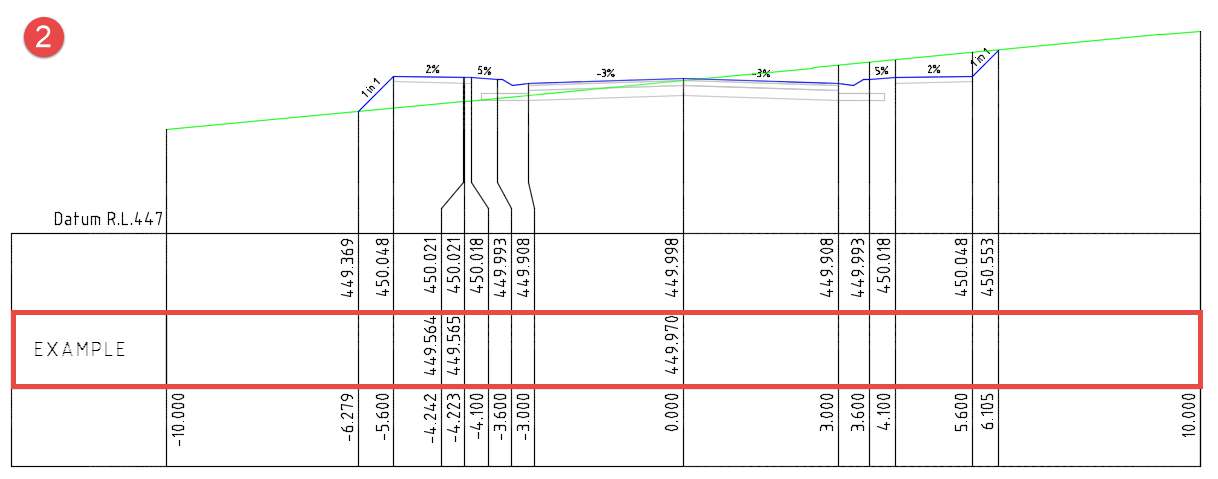 The offsets from this band are shown completely. For offsets from other bands, only the line is shown (if Apply Label Styles is selected, then the Line Labels style is applied for these cases). |
||||||||||||||||||||||||||||||||||||||||||||||||||||||||||||||||||||||||||||||||||
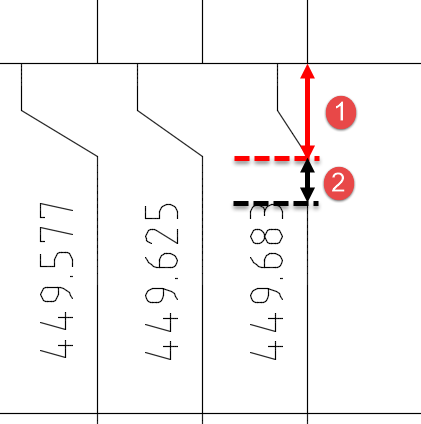
| Text Crank Controls | Sets how text cranking is managed. By default, cranking occurs above the topmost band, however users can elect to add cranking inside the current band, or ignore cranking for the current band. | ||||||||||||||||||||||||||||||||||||||||||||||||||||||||||||||||||||||||||||||||||
| Text Crank Settings |
|
||||||||||||||||||||||||||||||||||||||||||||||||||||||||||||||||||||||||||||||||||
| In Band Crank Distance |
|
||||||||||||||||||||||||||||||||||||||||||||||||||||||||||||||||||||||||||||||||||
| Offset Filtering for Plotting | Allows the user to filter (remove) offsets from the band. This does not remove offsets that come from other bands (the Offset Group) | ||||||||||||||||||||||||||||||||||||||||||||||||||||||||||||||||||||||||||||||||||
| Grade Break (%) | Filtering will be determined on the maximum grade break between offsets. | ||||||||||||||||||||||||||||||||||||||||||||||||||||||||||||||||||||||||||||||||||
| Height Difference | Filtering will be determined on the maximum height difference between offsets. | ||||||||||||||||||||||||||||||||||||||||||||||||||||||||||||||||||||||||||||||||||
| Minimum Offset | Filtering will be determined on the minimum distance between offsets. | ||||||||||||||||||||||||||||||||||||||||||||||||||||||||||||||||||||||||||||||||||
| Chord Height Difference | Filtering will be determined on the maximum chord height difference between offsets. | ||||||||||||||||||||||||||||||||||||||||||||||||||||||||||||||||||||||||||||||||||
| Direction of Processing | User can choose the direction in which the filtering occurs. Options are: - Left to Right - Right to Left - from CL - from Centreline out - from Outside - from left/right extents toward the centreline |
||||||||||||||||||||||||||||||||||||||||||||||||||||||||||||||||||||||||||||||||||
| SECTION LABELS TAB | |||||||||||||||||||||||||||||||||||||||||||||||||||||||||||||||||||||||||||||||||||
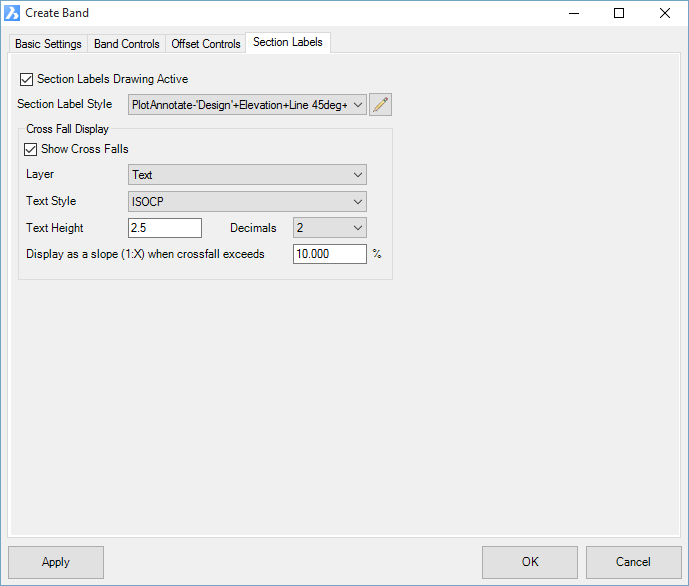 |
|||||||||||||||||||||||||||||||||||||||||||||||||||||||||||||||||||||||||||||||||||
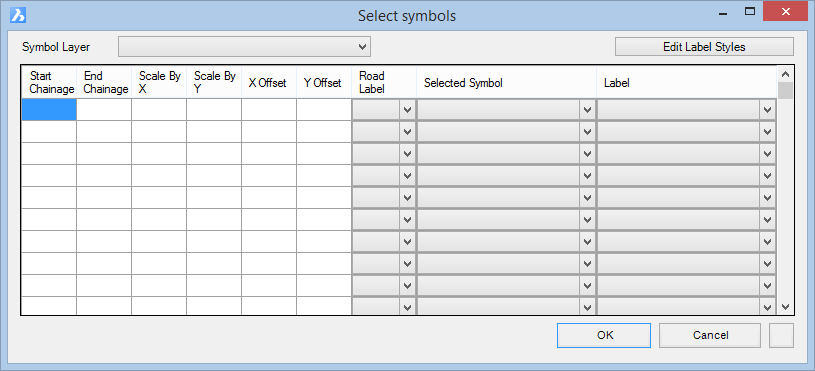
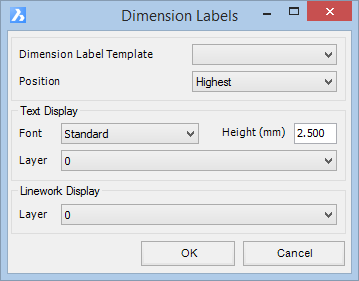
| Section Label Style | Select a Section Label Style to apply to the section view at the offsets. The elevation position of these is subject to the Band Data Source selected. Label Styles can consist of Symbols (Blocks), Lines (Polylines) and Text. Text elements can include the following Items (object properties):
Refer to the Label Styles command for information on how label styles are constructed and where Text Items are applied. |
||||||||||||||||||||||||||||||||||||||||||||||||||||||||||||||||||||||||||||||||||
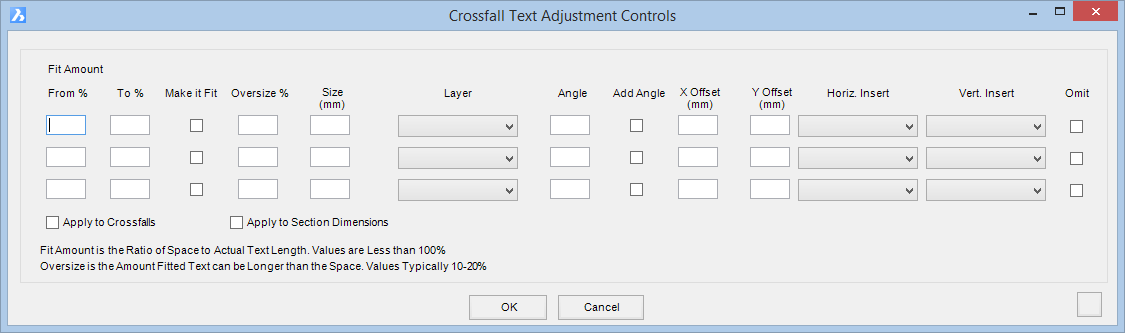
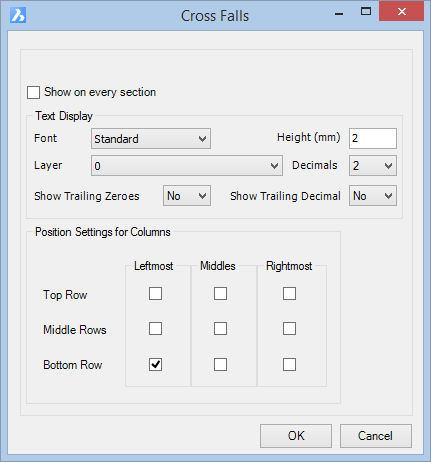
| Show Cross Falls | Each Band can be set to display crossfalls. By default crossfalls are displayed on the first cross sections per page/sheet, and where it changes along the sheet. For further control over how crossfalls are displayed, users can add a Crossfall Annotation control. |
||||||||||||||||||||||||||||||||||||||||||||||||||||||||||||||||||||||||||||||||||
| Layer | Layer to display crossfalls | ||||||||||||||||||||||||||||||||||||||||||||||||||||||||||||||||||||||||||||||||||
| Text Style | Select a text style to use | ||||||||||||||||||||||||||||||||||||||||||||||||||||||||||||||||||||||||||||||||||
| Text Height | Type in a text height | ||||||||||||||||||||||||||||||||||||||||||||||||||||||||||||||||||||||||||||||||||
| Decimals | Set the number of decimal places to display. To manage trailing decimals, add a Crossfall Annotation entry. | ||||||||||||||||||||||||||||||||||||||||||||||||||||||||||||||||||||||||||||||||||
| Display as a slope (1:X) when crossfall exceeds | Type a % value. If this value is exceeded, then that label will display with a slope format instead of a percentage format. | ||||||||||||||||||||||||||||||||||||||||||||||||||||||||||||||||||||||||||||||||||

Pre Set Bands
| Pre Set Bands can be selected, which will open the Add Bands form and pre-populate the Data Source. |
Other Bands
| Below is listed each of the Other Bands that can be added. Typically, these bands manage overall band display and behaviour. | ||||||||||||
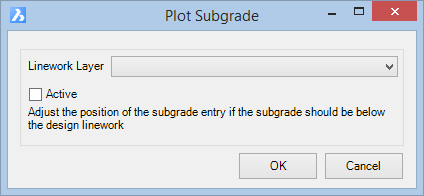
| Subgrade | This draws a line for the subgrade, as designed on the String being plotted. Inputs as follows:
|
|||||||||||
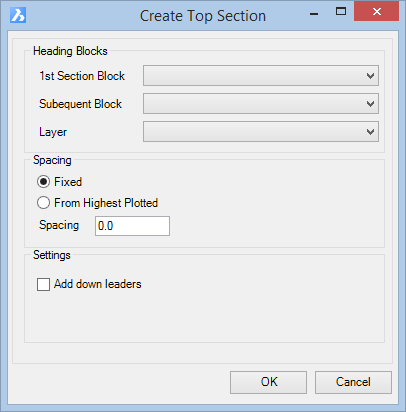
| Top Band | This entry enables bands to be displayed above the sections, Any Band entries listed below this band will show ABOVE the sections. Example of the Top Bands entry being added and entries being moved below: Top Band is the last entry: 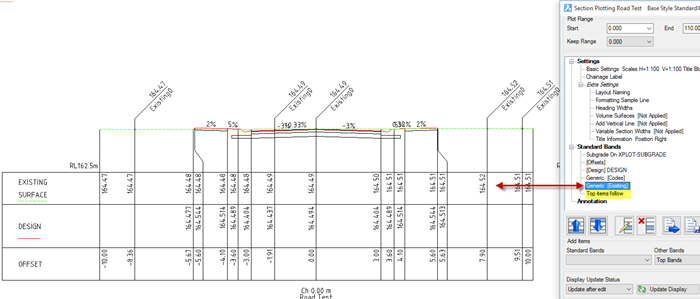 Top Band is not the last entry: 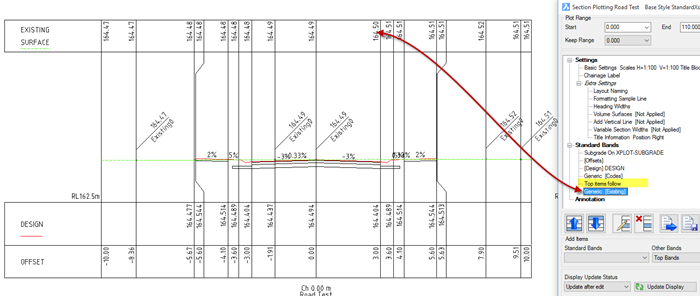 Inputs are as follows:
|
|||||||||||
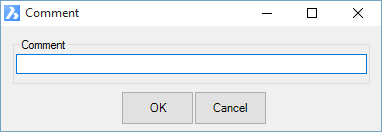
| Comment | Adds a comment field in the Band list. Inputs as follows:
|
|||||||||||