| Report Format |
Select a Report Format to populate the list of reportable Items. Users can create different Report Formats for different types of reports that are to be created. Each Report Format is saved upon exiting the form. |
| Pick List |
Drop down list of available Report Formats. Click on the drop down arrow and select a name to change the report list. Once a Report Format is selected, the report list is adjusted and any changes to the list are saved to the current Report Format. |
 Add New Report Format Add New Report Format |
Creates a new blank Report Format for later use on other drawings or projects. Upon selecting this command the following form is displayed:

|
| Name |
Enter a Report Format Name in the box provided. The name entered should consist of alpha-numeric characters only. If a name is typed in that matches an existing format an error message will display, as shown below, and the format will not be created.

|
| OK |
Select OK to continue and return to Add Report Format form. |
|
| Existing Report Format |
Provides a list of existing report formats. |
| OK |
Create the new Report Format and return to Report Manager. A blank list will be displayed for columns of information to be added. |
| Cancel |
Exit the form without creating a new Report Format. |
Should the same report name be entered as per one in the list of existing reports, the following form is displayed:
|
 Delete Current Report Format Delete Current Report Format |
Click to delete the current Report Format. |
 Copy Current Report Format Copy Current Report Format |
Click to create a copy of the current Report Format. Upon selecting this command the following form is displayed:

|
| Name |
Enter a Report Format Name in the box provided. The name entered should consist of alpha-numeric characters only. If a name is typed in that matches an existing format an error message will display, as shown below, and the format will not be created.
|
| OK |
Select OK to continue and return to Add Report Format form. |
|
| Existing Report Format |
Provides a list of existing report formats. |
| OK |
Create a copy of the current Report Format and return to Report Manager. |
| Cancel |
Exit the form without creating a new Report Format. |
|
 Save Current Report Format Save Current Report Format |
Click to save the changes made to the current Report Format. Note: All changes to the current Report Format are saved at the time of exiting the form or generating a report. |
 Export Current Report Format Export Current Report Format |
All the reports are contained in a single file. Click on Export Format to export the single Report Format to file. The specific Format can then be readily shared to others. The following form is displayed:

|
| Save In: |
Use the pick box to select a folder to save the file to |
| File Name |
Type in a file name. |
| Save |
Click to save the exported Report Format |
| Cancel |
Exit the form without exporting the Report Format to file |
|
 Import Report Format Import Report Format |
Click to import an exported Report Format. The following form is displayed:

|
| Look In: |
Use the pick box to select a folder to look in for the required file |
| List |
Click to select and highlight a file from the list. |
| File Name |
Type in a file name, if known |
| Open |
Click to import the Report Format |
| Cancel |
Exit the form without exporting the Report Format to file |
|
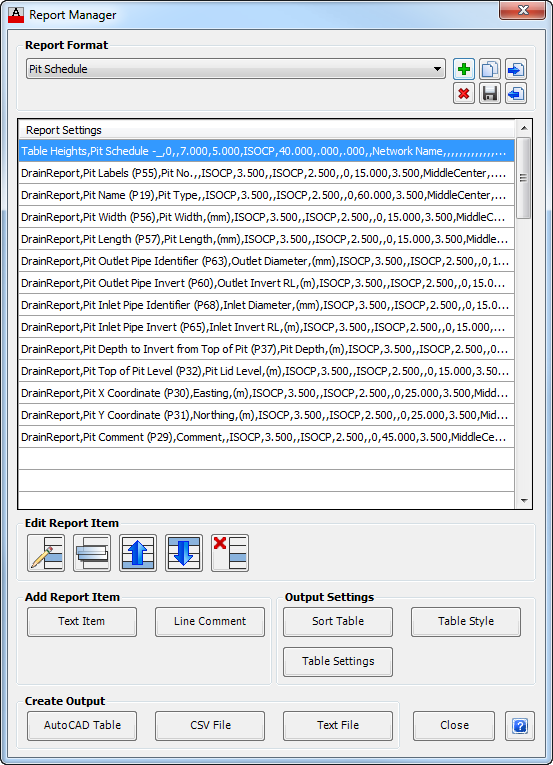
| Data List |
This lists all the items to be included in the report. The list may also contain a number settings controls to manage the output of the table. This may include a sorting control for the ordering of the rows in the output reports and/or controls on the AutoCAD table output.
A typical list is shown, below:

The Text Items are plotted in column order with the top row = left column and bottom row = right column. As Text Items are added they are positioned at the bottom of the list.
Comments may be included in the list to assist in the logical ordering of the information. Comment lines are not included in the table output.
Table settings controls and sorting controls should be added ONCE ONLY, otherwise the outputs may not be as expected.
Data in the list may be re-ordered, copied, deleted or edited. Highlight an item in the list and use one of the Edit Data Band/Controls to make a change. |
| Edit Report Item |
Includes tools to edit the information displayed in the Report. |
 Edit Current Line Edit Current Line |
Edit the currently highlighted item. The relevant form for the data will display for the details to be adjusted. |
 Copy Copy |
Copy the currently highlighted item. The copy will be added to the bottom of the list. Use Edit Current Line to edit the item to display the desired information. Use Move Up to position it as required in the table output. |
 Move Up Move Up |
Move the currently highlighted item up one to change the data band order in the report. |
 Move Down Move Down |
Move the currently highlighted item down one to change the data band order in the report |
 Delete Current Line Delete Current Line |
Delete the currently highlighted item. |
| Copy |
Copy the currently highlighted item. The copy will be added to the bottom of the list. Use Edit Current Line to edit the item to display the desired information. Use Move Up to position it as required in the table output. |
| Add Report Item |
Adds Items to main list. Text Items represent columns of data in the generated report. Tools are included here to create new Items for inclusion in the Report. |
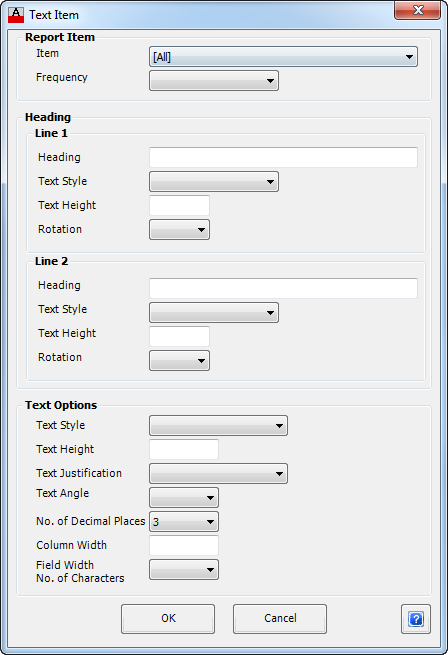
| Text Item |
Click to add data to the report. Each Text Item represents a column of data in the outputted Report. Pipe,
Structure, Catchment and Hydraulic data is able to be included in the Report using this command. The software stores a collection of Reportable Items that can be included in reports or in a Long Section output - click here for a list of the items that may be included in a report.
Upon starting this command the following form is displayed:
|
| Report Item |
Allows the user to select which Property (Reportable Item) of the network to include in the Data rows. The selection of items will be subject to the type of report required. For drainage networks, some items have differing values depending on the storm frequency (ARI) - for these items users should specify the Frequency to report. |
| Item |
From the drop down list, select the item that is to be displayed for this column of the Report. Click here for a list of reportable items.
The list will initially display all available Reportable Items. At the top of the list of items are CATEGORIES, allowing the user to filter the list based on the category. Users can pick a category in the list - when they re-select the list the reportable items will be filtered based on the selected Category. Note: The assignment of Reportable Items to different Categories is controlled by the Categorise Items command. |
| Frequency |
Use the pick list to select a storm frequency. Each storm frequency set in the Active Network Settings (Drainage, Design Settings tab) is listed for selection. Both the title (eg: Major, Minor) and the ARI (eg: 100,10) are able to be selected.
The value for that item will be reported based on the selected Frequency. Note: This pick list item is only required to be used if a property (reportable item) is selected that has different values depending on the storm frequency. |
| Heading |
Users have full control over the Heading applied to the column of data. Two heading Rows are able to be specified. |
| Line 1 |
Sets the text output for the first line of the Heading: |
| Heading |
Enter text for the first line of the first line of the Heading. This is normally used as the main description of the item. |
| Text Style |
Use the pick list to set the Text Style required for the first line of the Heading, from a list of all text styles available in the drawing. Note: This field is only used if an AutoCAD table is generated. If the field is left blank the value of the current AutoCAD Table Style is applied |
| Text Height |
Type in the text height required. Note: This field is only used if an AutoCAD table is generated. If the field is left blank the value of the current AutoCAD Table Style is applied. |
| Rotation |
Use the pick list to select the rotation of the text. 0, 90, 180 and 270 degrees may be selected. |
| Line 2 |
Sets the text output for the second line of the Heading: |
| Heading |
Enter text for the second line of the first line of the Heading. This is normally used as the secondary description of the item, or to list the units of measurement. |
| Text Style |
Use the pick list to set the Text Style required for the first line of the Heading, from a list of all text styles available in the drawing. Note: This field is only used if an AutoCAD table is generated. If the field is left blank the value of the current AutoCAD Table Style is applied |
| Text Height |
Type in the text height required. Note: This field is only used if an AutoCAD table is generated. If the field is left blank the value of the current AutoCAD Table Style is applied |
| Rotation |
Use the pick list to select the rotation of the text. 0 (horizontal), 90, 180 and 270 degrees (anti-clockwise rotation) may be selected. |
| Text Options |
Users have full control over the Heading applied to the column of data. Two heading Rows are able to be specified. |
| Text Style |
Use the pick list to set the Text Style required for the data row text, from a list of all text styles available in the drawing. Note: This field is only used if an AutoCAD table is generated. If the field is left blank the value of the current AutoCAD Table Style is applied |
| Text Height |
Type in the text height required. Note: This field is only used if an AutoCAD table is generated. If the field is left blank the value of the current AutoCAD Table Style is applied |
| Text Justification |
Use the pick list to set the justification of the data row text in the cell. Users are able to choose from 9 text positions to allow left, middle and right justification both horizontally and vertically in the cell. Note: This field is only used if an AutoCAD table is generated. If the field is left blank the value of the current AutoCAD Table Style is applied |
| Text Angle |
Use the pick list to select the rotation of the text. 0 (horizontal), 90, 180 and 270 degrees (anti-clockwise rotation) may be selected. Note: This field is only used if an AutoCAD table is generated. If the field is left blank the value of the current AutoCAD Table Style is applied |
| No. Decimal Places |
Use the pick list to set the number of decimal places to report for the text item. Where a numerical value is reported, users can select from 0 decimal places (whole number) to 3 decimal places to be displayed. |
| Column Width |
Enter the plotted width of the column. Note: This field is only used if an AutoCAD table is generated. If the field is left blank the value of the current AutoCAD Table Style is applied |
| Field Width |
Not used |
| OK |
Add item to the list in the Report Manager. |
| Cancel |
Exit the form without adding/editing the item. |
There are a number of text items that can be included in a report. Further details are described here.
|
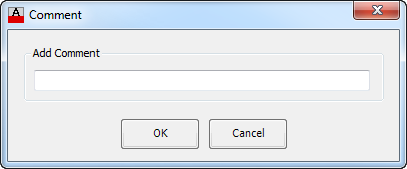
| Line Comment |
Click to add a Comment line in the report list. Any Comment added will not be included in the output report in any way, but can be used to help logically arrange the data listed. Upon selecting the command the following form will be displayed:
|
| Add Comment |
Type in a comment to add to the list |
| OK |
Close the form and add the comment to the list. |
| Cancel |
Exit the form without adding the comment |
|
| Output Settings |
Use these controls to manage the outputs. Users can choose how to sort the rows of data in the output, as well as controlling the AutoCAD table output. It is STRONGLY RECOMMENDED that users add only ONE of each of the output settings controls, otherwise the outputs may not be as expected. |
| Sort Table |
Click to sort the table using a variety of controls. Upon selecting the command the following form will be displayed:

|
| Sort By |
Use the pick list to choose a parameter to sort the list by. Options include:
- Sort Upstream from Outlet
- From Upstream Structures Down
- Increasing Structure Depths
- Increasing Structure Heights
- Structure Label
- Increasing Chainage from Downstream
- Road Name and Chainage
- Structure Type
- Line Number and Structure Number
|
| OK |
Close the form and add the sorting control |
| Cancel |
Exit the form without adding the control |
|
| Table Settings |
This control manages the overall title of the report, as well as establish user control over the AutoCAD table output (override controls to the AutoCAD Table Settings). Note: It is strongly recommended that this item be added to every report format, prior to creating a report. Unexpected results will occur if this control is not added before creating an AutoCAD table output. Form details are as follows:

|
| Table Style Controls |
Users are able to set the font, row and text height for the Title of the report, as well as setting heading and data row heights. All these settings apply to users creating an AutoCAD table output and serve as an override to the current AutoCAD Table Style set in the drawing |
| Title Row Height |
Type in a value to set the height of the Title Row. Note: This field is only used if an AutoCAD table is generated. If the field is left blank the value of the current AutoCAD Table Style is applied |
| Title Text Height |
Type in the text height required for the Title. Note: This field is only used if an AutoCAD table is generated. If the field is left blank the value of the current AutoCAD Table Style is applied |
| Title Font |
Use the pick list to set the text style used for the Title. Note: This field is only used if an AutoCAD table is generated. If the field is left blank the value of the current AutoCAD Table Style is applied |
| Heading Line 1 Row Height |
Type in the row height required for the first line of the Heading. This is useful particularly when vertical text is used in the heading. Note: This field is only used if an AutoCAD table is generated. If the field is left blank the value of the current AutoCAD Table Style is applied |
| Heading Line 2 Row Height |
Type in the row height required for the second line of the Heading. This is useful particularly when vertical text is used in the heading. Note: This field is only used if an AutoCAD table is generated. If the field is left blank the value of the current AutoCAD Table Style is applied. |
| Data Row Height |
Type in the row height required for the data. Note: This field is only used if an AutoCAD table is generated. If the field is left blank the value of the current AutoCAD Table Style is applied |
| Title Contents |
Users are able to set the title of the report by typing in a static name as well as appending network properties. Up to six properties of the network can be added to the Title. |
| Title Prefix |
This is the overall prefix for the title. It precedes any other text that may form part of the Title contents. Note: Use an underscore ( _ ) at the start or end of the text string to create a space in the text. |
| Item 1 to Item 6 |
Users are able to add up to 6 network parameters to form part of the Title contents, including a prefix and suffix to each parameter. Text will be added as a continuous string using each Item, from Item 1 to Item 6. For each Item, the input parameters are as follows: The left cell is available for the user to type in a prefix to the property item.
Use the pick list in the central cell to select a Network Parameter to include in the Title. Parameters available to be added to the title include:
- Network Name
- Minimum tc Structures
- Maximum tc Structures
- Maximum tc Pipes
- Rainfall Location
- Frequency
The right cell is available for the user to type in a suffix to the property item.
Note: Use an underscore ( _ ) at the start or end of the text string to create a space in the text.
|
| Title Suffix |
This is the overall suffix for the title. It will be positioned at the end of any other text that may form part of the Title contents. Note: Use an underscore ( _ ) at the start or end of the text string to create a space in the text. |
| Downstream Structure Selection |
Users are able to set whether to most downstream
structure (outlet) is included in the report. |
| Include Downstream
Structure in Report |
Toggle this on to include the outlet
structure in the report. |
| Chainage Settings |
Users are able to set how the Chainages are calculated for the Lines/Branches. |
| Line Chainages Start at Zero |
Tick this option to enable all Lines/Branches of the network to start at Chainage 0. Select either Compute Chainages Going Upstream or Compute Chainages Going Downstream to control the Line/Branch chainage reporting direction. |
| OK |
Close the form and add the Table Settings |
| Cancel |
Exit the form without adding the Table Settings |
|
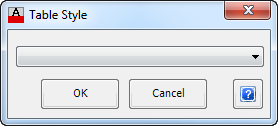
| AutoCAD Table Style |
Users are able to set the AutoCAD Table Style to use for the output, instead of using the default AutoCAD table style as defined in the drawing. Upon selecting the command the following form will be displayed:
|
| Pick List |
Pick list box of available AutoCAD Table Style that can be used to control the presentation of the report. Note: This setting control will only be used if creating an AutoCAD table report. |
| OK |
Apply and return to Report Manager. |
| Cancel |
Exit the form without deleting any data. |
|
Create Output |
Used to create the report. Three (3) different output formats are available. Depending on the reportable items included in the report, users may be required to select the storm frequency to apply when creating the table. |
| AutoCAD Table |
This will create a AutoCAD Table in the current drawing, using the data and AutoCAD table controls specified in the Data List.
After this command is selected, the user may be required to set the Storm Frequency to use if text items have been added that are dependent on the Storm Frequency. Select a frequency and click OK or press Cancel to exit the command.
At the command prompt to select a position in the drawing for the table, click the left mouse button in the drawing to position the top left corner of the table at the selected location in the drawing.
After a location has been selected and the Report has been created, the Report Manager will be redisplayed.
|
| CSV File |
This will create a csv File of the Report, using the data controls specified in the Data List. |
| Text File |
This will create a Text File of the Report, using the data controls specified in the Data List. |
| Cancel |
Exit the form without generating a report. |