Compare Report
Icon: |
|
Introduction
This command allows the comparison of different objects in the drawing to find distance tolerances, elevation tolerances and other comparison information.
Users can compare points to points, points to surfaces, points to alignment and more. Detailed information is output to a spreadsheet view and is able to be exported to tables or spreadsheet (via a comma separated file). The column information in the spreadsheet view will change to suit the report type selected.
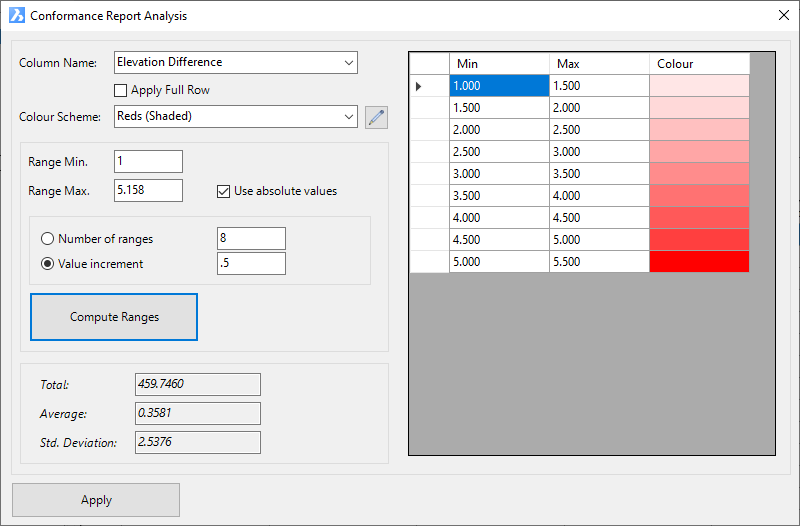
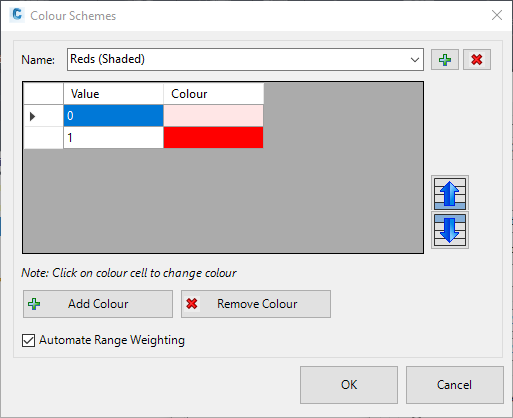
Each line (or the analysed cell) can be coloured to highlight tolerance issues (such as surveyed points being too far above or below a surface).
Objects being compared include:
-
Points
-
Surfaces
-
Alignments
-
Strings
-
Lines
-
Polylines
-
Alignments
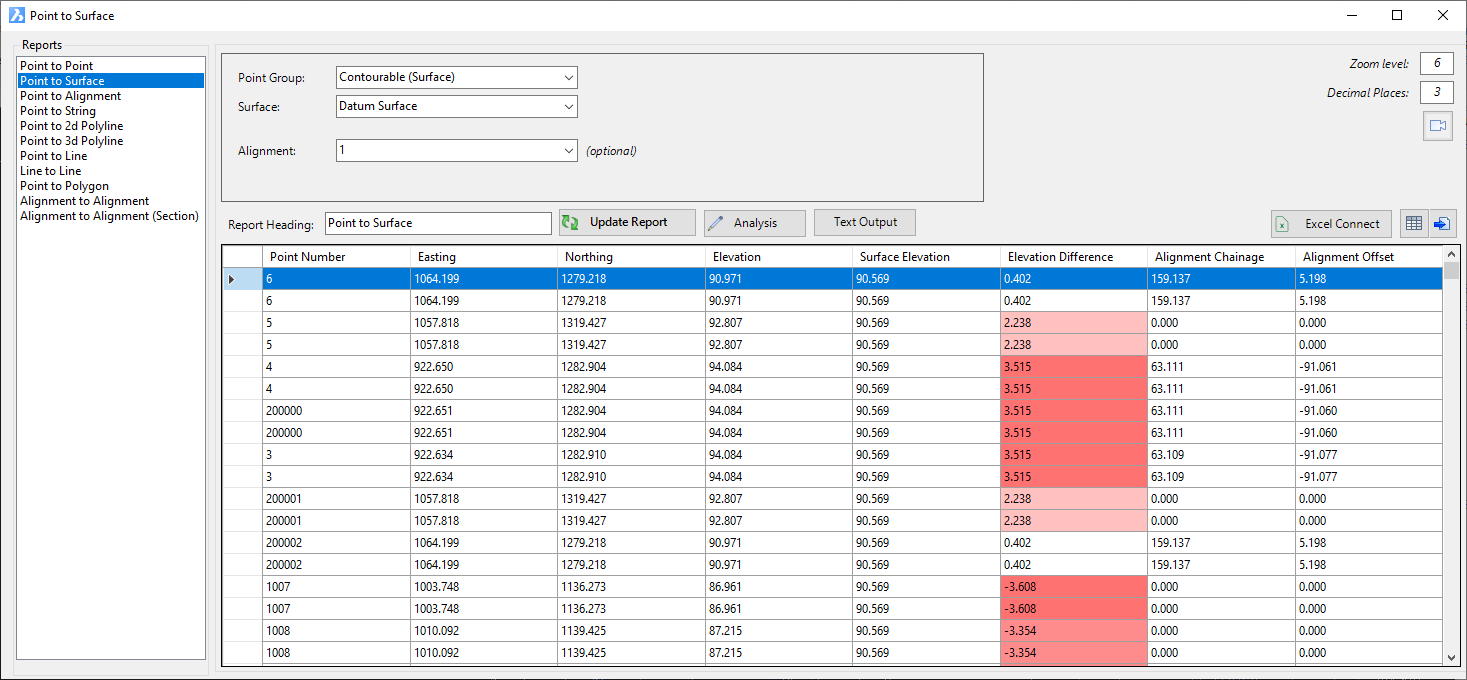
The form is split in two. On the left is a list of reports comparing objects. The inputs on the right side change based on the report type selected - once inputs are selected for comparison, clicking on the Update Report button will populate the spreadsheet view below.
Outputs
Outputs from the comparison includes:
-
Adding text to the drawing at each point describing any column from the report. Only useful for reports related to Points
-
Export to an Excel spreadsheet (.xls)
-
Export to a table in the drawing
-
Export to a file
Excel Output
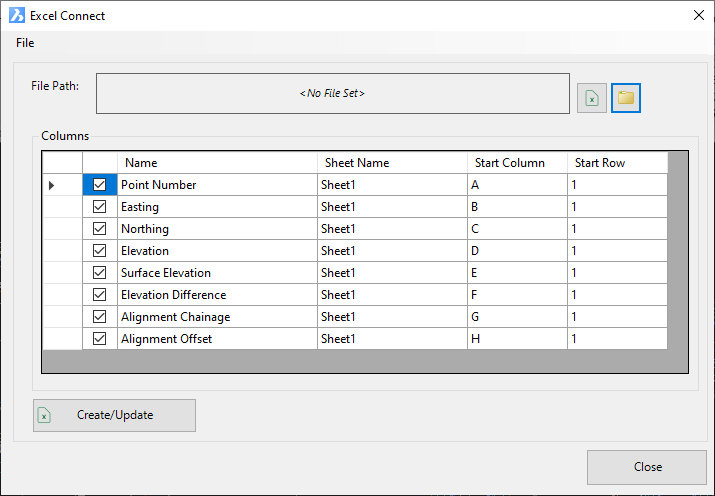
When outputting to Excel, the user is able to create a new Excel file, or append to an existing file (the file should not be open for editing at the time of export). Excel must be installed on the computer to use this functionality.
Users can pick which columns of the report to export, the Sheet name to create or add data to, and the column (as well as the starting row) to add to in the Excel worksheet. This functionality allows users to update existing spreadsheets with any information from the report.
Details
Upon selecting the command the following form is displayed:
|
|
|||||||||||||||||||||||||||||||||||||||||||||||||||||||||||||
|
Report |
List of available reports. Click on a Report Type to select inputs and generate a report. | ||||||||||||||||||||||||||||||||||||||||||||||||||||||||||||
|
[List of Report Types] |
Select a Report Type to set up and create. The right side panel options will change to reflect the inputs required. | ||||||||||||||||||||||||||||||||||||||||||||||||||||||||||||
|
Report Inputs |
Report inputs are dynamic and display pending the Report Type selected. All possible inputs are shown, below: |
||||||||||||||||||||||||||||||||||||||||||||||||||||||||||||
|
Point Group/Point Group 1 |
Select a point group from the pick list. Displayed for Report Types: Point to Point, Point to Surface, Point to Alignment, Point to String, Point to 2D Polyline, Point to 3d Polyline, Point to Line, Point to Polygon |
||||||||||||||||||||||||||||||||||||||||||||||||||||||||||||
|
Point Group ` |
Select a point group from the pick list. Displayed for Report Types: Point to Point |
||||||||||||||||||||||||||||||||||||||||||||||||||||||||||||
|
Polyline |
Use the Pick icon, then at the prompt click in the drawing,
then click on a polyline. The object ID will display Displayed for Report Types: Point to 2D Polyline, Point to 3D Polyline, Point to Polygon |
||||||||||||||||||||||||||||||||||||||||||||||||||||||||||||
|
Line/Line 1 |
Use the Pick icon, then at the prompt click in the drawing,
then click on a line. The object ID will display Displayed for Report Types: Point to Line, Line to Line |
||||||||||||||||||||||||||||||||||||||||||||||||||||||||||||
|
Line 2 |
Use the Pick icon, then at the prompt click in the drawing,
then click on a line. The object ID will display Displayed for Report Types: Line to Line |
||||||||||||||||||||||||||||||||||||||||||||||||||||||||||||
|
String |
Select a created String from the pick list. Displayed for Report Types: Point to String |
||||||||||||||||||||||||||||||||||||||||||||||||||||||||||||
|
Code |
Select a Code (from the selected String)from the pick list. Displayed for Report Types: Point to String |
||||||||||||||||||||||||||||||||||||||||||||||||||||||||||||
|
Display closest alignment details |
Select a point group from the pick list. Displayed for Report Types: Point to Point |
||||||||||||||||||||||||||||||||||||||||||||||||||||||||||||
|
Alignment/Alignment 1 |
Select an alignment from the pick list. Displayed for Report Types: Point to Point, Point to Surface, Point to Alignment, Alignment to Alignment, Alignment to Alignment (section) |
||||||||||||||||||||||||||||||||||||||||||||||||||||||||||||
|
Alignment 2 |
Select an alignment from the pick list. Displayed for Report Types: Alignment to Alignment, Alignment to Alignment (section) |
||||||||||||||||||||||||||||||||||||||||||||||||||||||||||||
|
Display closest alignment details |
Tick on to have the software automatically report the
chainage/offset to the nearest alignment in the drawing.
This will override any Alignment selected. Untick to report chainage/offset only to the selected Alignment. Displayed for Report Types: Point to Alignment |
||||||||||||||||||||||||||||||||||||||||||||||||||||||||||||
|
Zoom Level |
Type in an integer for the zoom level when zooming to points selected in the report list. | ||||||||||||||||||||||||||||||||||||||||||||||||||||||||||||
|
Decimal Places |
Type in the number of decimal places to report | ||||||||||||||||||||||||||||||||||||||||||||||||||||||||||||
|
Report Heading |
Type in a heading to add to the report outputs (table in the drawing or file) |
||||||||||||||||||||||||||||||||||||||||||||||||||||||||||||
|
Update Report |
Click to recalculate the report output | ||||||||||||||||||||||||||||||||||||||||||||||||||||||||||||
| Analysis |
|
||||||||||||||||||||||||||||||||||||||||||||||||||||||||||||
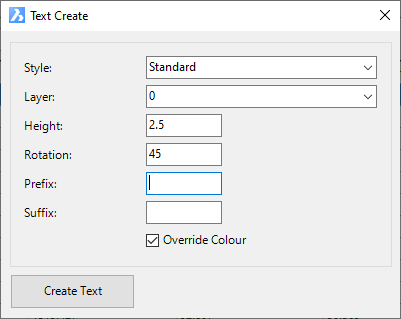
| Text Output |
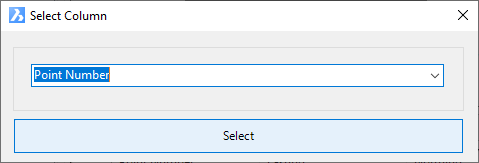
This command adds text to the drawing using an output column
from the report
|
||||||||||||||||||||||||||||||||||||||||||||||||||||||||||||
| Excel Connect |
Export the contents of the spreadsheet view to Excel.
|
||||||||||||||||||||||||||||||||||||||||||||||||||||||||||||
| Export to Table | Click to create a Table in the drawing. At the command prompt, click in the drawing, then click where the table (top left corner) should be inserted. | ||||||||||||||||||||||||||||||||||||||||||||||||||||||||||||
| Export to File | Creates a .csv file and opens the file for viewing. User will be prompted to pick a save location and filename. | ||||||||||||||||||||||||||||||||||||||||||||||||||||||||||||
|
Report Outputs |
Spreadsheet view of the report results. Inputs vary pending the Report Type selected. | ||||||||||||||||||||||||||||||||||||||||||||||||||||||||||||